Need to write math equations in Obsidian? Here's how to write math notation easily and efficiently in Obsidian.

Jump mechanics are a fundamental aspect of many platformer games, allowing players to navigate obstacles, reach higher platforms, and add an extra layer of interactivity to the

Make your arcade game more fun by adding randomly moving objects. Here are detailed instructions.

LangChain LLM is a hot topic in the programming world. Here's everything you need to know about LangChain LLM.

Creating tags with HTML is not difficult. However, you can learn how to craft a more attractive custom card element to incorporate it into your design.

Most web applications react to click events in different ways, and detecting exactly where the click is is important for the UI to function properly.

You can program interesting environments for Godot games with animated effects. Here's how to create 2D animations in Godot using AnimatedSprite.

When managing complex state in the Next app, things can get tricky. However, you can overcome it by learning the fundamentals of React and managing state through this classic app.

Single color was the trend of last year. Gradient is currently 'on the throne'! But do you know how to create a background gradient in CSS?

Are you looking to upgrade your React programming skills? Then try to build your own version of Hacker News with the help of the guide below.

When it comes to free and open source software (FOSS), many people may feel 'stuck' as if they are lost in a sea of misconceptions.

Let's learn how to build a task management app using CRUD principles and a class-based viewer in Django.

Role-based access control is a secure authentication mechanism. You can use it to restrict access to certain resources.

Upgrading React app state management with Jotai is a simpler alternative to Redux, and perfect for small projects. Here are detailed instructions.

Want to know how to stack and append data in Excel? Then let's learn how to use the VSTACK and HSTACK functions in Microsoft Excel!

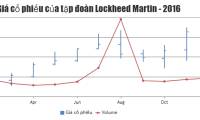
The example below illustrates a sample of the 2016 Lockheed Martin stock price chart with the number of shares by combining the OHLC and line graphs.

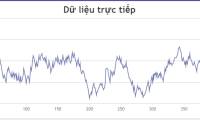
The example below illustrates a dynamic chart template created with JavaScript. This JavaScript sample code for a live data updated chart template.

Are you getting the 'Word Found Unreadable Content' error? Here are some easy and quick steps to fix 'Word Found Unreadable Content'.

The example below illustrates a line chart template created with JavaScript. It updates data every 500 milliseconds. The article also provides source code for you to edit in the

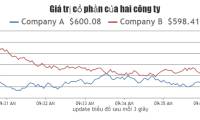
The example below illustrates a multi-series line chart pattern that is updated every 3 seconds. It is created with JavaScript.
 Need to write math equations in Obsidian? Here's how to write math notation easily and efficiently in Obsidian.
 Jump mechanics are a fundamental aspect of many platformer games, allowing players to navigate obstacles, reach higher platforms, and add an extra layer of interactivity to the
 Make your arcade game more fun by adding randomly moving objects. Here are detailed instructions.
 LangChain LLM is a hot topic in the programming world. Here's everything you need to know about LangChain LLM.
 Creating tags with HTML is not difficult. However, you can learn how to craft a more attractive custom card element to incorporate it into your design.
 Most web applications react to click events in different ways, and detecting exactly where the click is is important for the UI to function properly.
 You can program interesting environments for Godot games with animated effects. Here's how to create 2D animations in Godot using AnimatedSprite.
 When managing complex state in the Next app, things can get tricky. However, you can overcome it by learning the fundamentals of React and managing state through this classic app.
 Single color was the trend of last year. Gradient is currently 'on the throne'! But do you know how to create a background gradient in CSS?
 Are you looking to upgrade your React programming skills? Then try to build your own version of Hacker News with the help of the guide below.
 When it comes to free and open source software (FOSS), many people may feel 'stuck' as if they are lost in a sea of misconceptions.
 Let's learn how to build a task management app using CRUD principles and a class-based viewer in Django.
 Role-based access control is a secure authentication mechanism. You can use it to restrict access to certain resources.
 Upgrading React app state management with Jotai is a simpler alternative to Redux, and perfect for small projects. Here are detailed instructions.
 Want to know how to stack and append data in Excel? Then let's learn how to use the VSTACK and HSTACK functions in Microsoft Excel!
 The example below illustrates a sample of the 2016 Lockheed Martin stock price chart with the number of shares by combining the OHLC and line graphs.
 The example below illustrates a dynamic chart template created with JavaScript. This JavaScript sample code for a live data updated chart template.
 Are you getting the 'Word Found Unreadable Content' error? Here are some easy and quick steps to fix 'Word Found Unreadable Content'.
 The example below illustrates a line chart template created with JavaScript. It updates data every 500 milliseconds. The article also provides source code for you to edit in the
 The example below illustrates a multi-series line chart pattern that is updated every 3 seconds. It is created with JavaScript.


