JavaScript code to create multi-series graphs that update live data
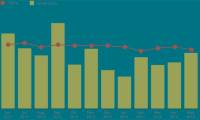
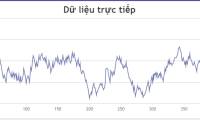
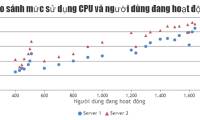
The example below illustrates a multi-series line chart pattern that is updated every 3 seconds. It is created with JavaScript.
Table of Contents
Dynamic charts also take the form of multiple data series. These charts are all interactive, responsive, support animations, events, and updates in real time.
The example below illustrates a multi-series line chart pattern that is updated every 3 seconds. It is created with JavaScript . The article also provides source code for you to edit in the browser or save to your computer to run locally.
Source : CanvasJS
Chart customization
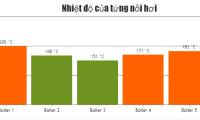
You can hide/unhide a data series using the visible. Events from legend entries are itemclickoften used to enable data series display. Other popular choices include: lineThicnkess(line thickness), markerType(mark style), lineColor(line color)…
Was this article helpful?
Your feedback helps us improve.
Related Articles
 Sample JavaScript code to create a chart with a second axis.1 minutes read
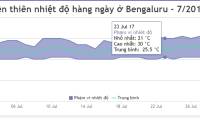
 JavaScript code to generate dynamic line graphs/charts1 minutes read
 JavaScript code to create dynamic charts/graphs1 minutes read
 JavaScript code to create a scatter plot with custom markers.1 minutes read
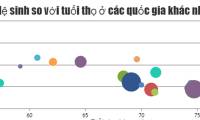 JavaScript code to create bubble charts and graphs.2 minutes read
 JavaScript code to create a combined area and line chart.1 minutes read
Reader Comments 0
Sign in with email or Google to join the discussion.