JavaScript code to generate dynamic line graphs/charts
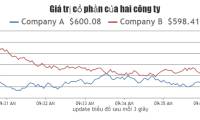
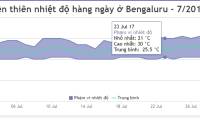
The example below illustrates a line chart template created with JavaScript. It updates data every 500 milliseconds. The article also provides source code for you to edit in the browser or save to your computer to run locally.
Table of Contents
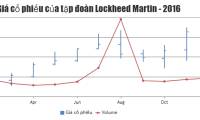
Dynamic charts created with JavaScript are useful for displaying time-varying data directly. Using line charts for real-time charts is very popular. They are interactive, responsive, support animations and live updates.
The example below illustrates a line chart template created with JavaScript . It updates data every 500 milliseconds. The article also provides source code for you to edit in the browser or save to your computer to run locally.
Source : CanvasJS
Chart customization
Crosshaircan be activated in the graph by creating a crosshair object. Other popular customization options are lineColor(line color), lineThickness(line thickness)…
Was this article helpful?
Your feedback helps us improve.
Related Articles
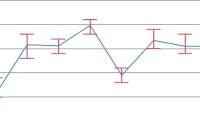 JavaScript code to generate error line graph/graph1 minutes read
 JavaScript code to create OHLC and line chart combo chart template1 minutes read
 JavaScript code to create multi-series graphs that update live data1 minutes read
 JavaScript code to create a combined area and line chart.1 minutes read
 JavaScript code to generate error charts & graphs1 minutes read
 JavaScript code to create dynamic charts/graphs1 minutes read
Reader Comments 0
Sign in with email or Google to join the discussion.