javascript code
-
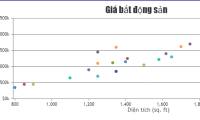
 JavaScript code to create a scatter plot/point chart
below is an example of a scatter plot/point chart created using javascript, along with the html source code that you can edit in your browser or save to your computer to run locally.
JavaScript code to create a scatter plot/point chart
below is an example of a scatter plot/point chart created using javascript, along with the html source code that you can edit in your browser or save to your computer to run locally.
-
What is Currying in Javascript? How to use Currying in JavaScript
the currying feature in javascript can help you keep your code tidy and give you a new way of seeing how functions work. currying is ideal when you want to break complex logic into smaller, manageable, and self-contained pieces of code.
-
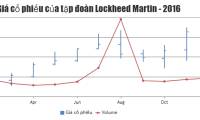
JavaScript code to create OHLC and line chart combo chart template
the example below illustrates a sample of the 2016 lockheed martin stock price chart with the number of shares by combining the ohlc and line graphs.
-
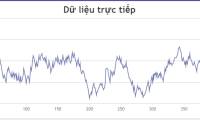
JavaScript code to generate dynamic line graphs/charts
the example below illustrates a line chart template created with javascript. it updates data every 500 milliseconds. the article also provides source code for you to edit in the browser or save to your computer to run locally.
-
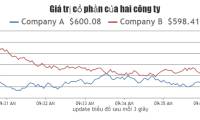
JavaScript code to create multi-series graphs that update live data
the example below illustrates a multi-series line chart pattern that is updated every 3 seconds. it is created with javascript.
-
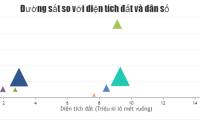
JavaScript code to create bubble chart with custom marker
the example below shows a bubble chart with a customized highlight style and javascript source code that you can edit in your browser or save to your device to run locally.
-
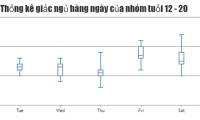
JavaScript code to generate box and whisker charts/graphs
the example below illustrates a box and whisker chart/graph template created with javascript. the article also provides the source code for you to edit in the browser and save to your computer to run locally.
-
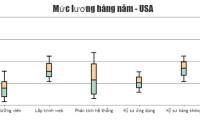
JavaScript code to create box & whisker chart/graph templates with custom colors
the example below illustrates a box & whisker chart template with customizable colors for the top and bottom boxes created with javascript.
-
JavaScript code that generates box and whisker charts containing outliers
the example below illustrates a box & whisker chart pattern with outlier values represented by a scatter plot. the article also provides javascript source code for you to edit or save to your computer to run internally.
-
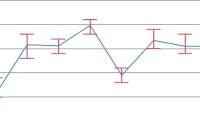
JavaScript code to generate error line graph/graph
the example below illustrates a sample error chart with line chart created with javascript. the article also provides source code for you to edit in the browser or save to your computer to run locally.
-
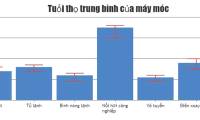
JavaScript code to generate error charts & graphs
the example below illustrates a sample variance chart created with javascript that incorporates a column chart. you will also get the source code for reference and editing as you wish.
-
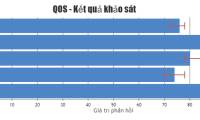
Code of chart/bar graph with error combination
the example below illustrates a bar chart template with errors created with javascript.