JavaScript code to create box & whisker chart/graph templates with custom colors
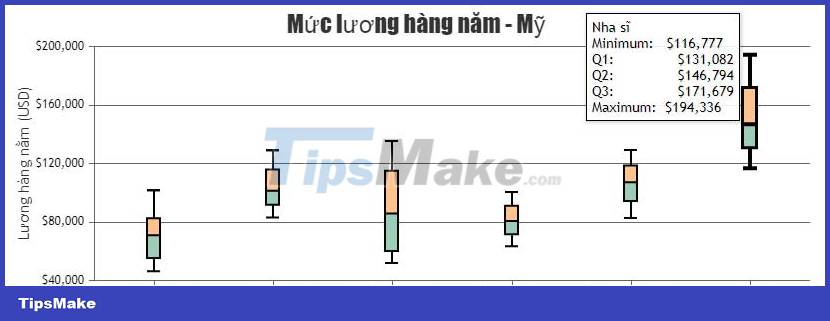
The example below illustrates a box & whisker chart template with customizable colors for the top and bottom boxes created with JavaScript..
You can easily customize box & whisker charts through the options provided by CanvasJS. You can easily edit the top and bottom boxes with different colors. The library also offers the option to change Median/Mean, Whisker and Stem lines by color and thickness.
The example below illustrates a box & whisker chart template with customizable top and bottom box colors created with JavaScript . You will also have the source code to edit in the browser or save to your computer to run locally.
Source: CanvasJS
Tweak the chart
If you want to create a box chart as you like, you can change the properties in the JavaScript code. For example:
upperBoxColor: Color of upper boxlowerBoxColor: Color of bottom boxlineColor: Line colorstemColor: Stem colorwhiskerColor: Whisker colorstemThickness: Stem Thicknesscolor: ColorlineDashType: Dash stylelineThickness: Line thickness- …