Code of chart/bar graph with error combination
The example below illustrates a bar chart template with errors created with JavaScript.
Table of Contents
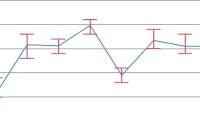
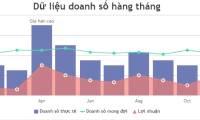
The margin of error/error plot gives you a glimpse of the margin of error and confidence. Error graph combined with bar chart will form error bar chart.
The example below illustrates a bar chart template with errors created with JavaScript . As you can see, this chart type supports animation, zoom, rotate, events, export as an image, and is cross-browser compatible. The article also provides the source code for you to edit in the browser or save to your computer to run locally.

Source : CanvasJS
Chart customization
You are free to edit this chart as you like by changing the properties. For example:
linkedDataSeriesIndex: Link an error series to another data series in the chart.stemColor: Body color.whiskerThickness: Extreme point thickness.Color: Color.
Was this article helpful?
Your feedback helps us improve.
Related Articles
 JavaScript code to generate error line graph/graph1 minutes read
 JavaScript code to create a chart/graph combining lines, areas, and columns.1 minutes read
 Invite to see malware with visual images with VirusTotal Graph4 minutes read
 Instructions for fixing device Usb error not recognized Code 437 minutes read
 How to fix error code 43 for NVIDIA or Intel GPUs on Windows6 minutes read
 Graph data structure (Graph)3 minutes read
Reader Comments 0
Sign in with email or Google to join the discussion.