JavaScript code that generates Pareto chart template with Index/Data . label
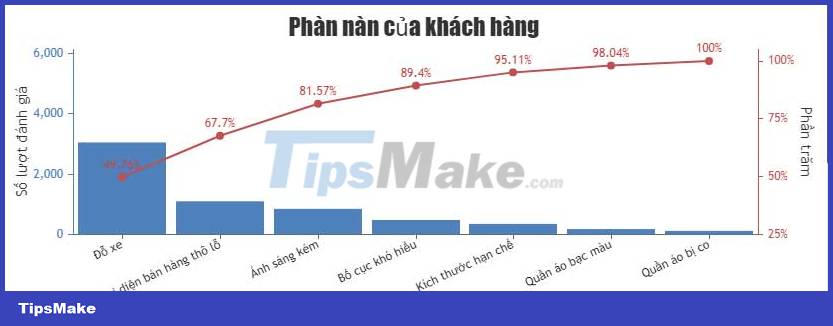
You can easily add and customize index/data labels to the pareto chart. The example below shows a Pareto chart with data/index labels created with JavaScript.
Table of Contents
The index/data label is used to show some additional information about the data points. You can easily add and customize index/data labels to the pareto chart. The example below shows a Pareto chart with data/index labels created with JavaScript .
The article also provides the source code for you to edit comfortably in the browser or save it to your computer to run locally.
Source : CanvasJS
Chart customization
You can change the color of the line using the lineColor. Other customization options include:
indexLabel: Index labelindexLabelFontColor: Index label font colorindexLabelFontSize: Index label font size…
Was this article helpful?
Your feedback helps us improve.
Related Articles
 JavaScript code to create Pareto charts & graphs1 minutes read
 JavaScript code that generates box and whisker charts containing outliers1 minutes read
 Steps to use Pareto chart in Excel2 minutes read
 JavaScript code to generate error charts & graphs1 minutes read
 JavaScript code to create box & whisker chart/graph templates with custom colors1 minutes read
 Code of chart/bar graph with error combination1 minutes read
Reader Comments 0
Sign in with email or Google to join the discussion.