JavaScript code to generate box and whisker charts/graphs
The example below illustrates a box and whisker chart/graph template created with JavaScript. The article also provides the source code for you to edit in the browser and save to your computer to run locally.
Table of Contents
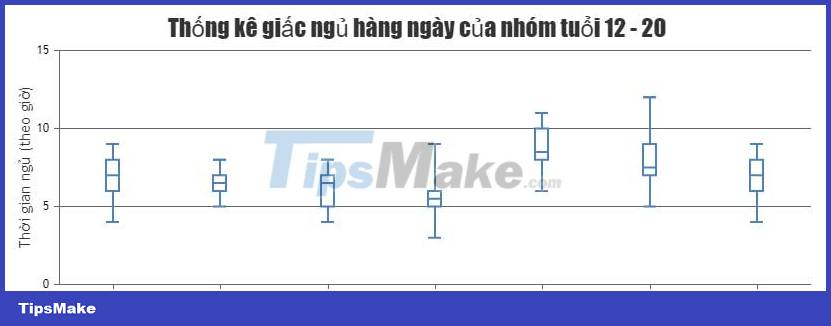
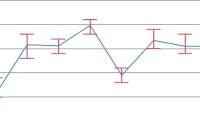
The JavaScript Box & Whisker Chart aka Box Plot is used to show the distribution of numeric data through their quartiles, while highlighting the averages.
The box plot has lines extending vertically from the cells containing the horizontal line at the extremes (whiskers), representing the change outside the upper and lower quartiles. Box and Whisker charts are interactive, support animations, export charts as images, and more.
The example below illustrates a box and whisker chart/graph template created with JavaScript . The article also provides the source code for you to edit in the browser and save to your computer to run locally.
Source : CanvasJS
Tweak the chart
You are free to change the property settings to get the way you want to draw box and whisker charts. For example:
uperBoxColor: Choose a color for the box abovelowerBoxColor: Choose a color for the box belowwhiskerColor: Choose a whisker colorwhiskerThickness: Thickness of whiskerstemColor: Stem color (body)Color: Color- .
Was this article helpful?
Your feedback helps us improve.
Related Articles
 JavaScript code that generates box and whisker charts containing outliers1 minutes read
 JavaScript code to create box & whisker chart/graph templates with custom colors1 minutes read
 JavaScript code to generate error charts & graphs1 minutes read
 JavaScript code to generate dynamic line graphs/charts1 minutes read
 JavaScript code to generate error line graph/graph1 minutes read
 Instructions on running Node JavaScript code in n8n7 minutes read
Reader Comments 0
Sign in with email or Google to join the discussion.