JavaScript code to generate error line graph/graph
The example below illustrates a sample Error Chart with Line Chart created with JavaScript. The article also provides source code for you to edit in the browser or save to your computer to run locally.
Table of Contents
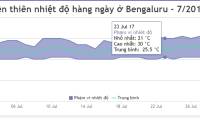
The Error Chart provides a general idea of the accuracy of a measurement. Error Graph, when combined with a Line Chart, will form an Error Line Chart. It can also be combined with a range or area chart.
The example below illustrates a sample Error Chart incorporating a Line Chart created with JavaScript . The article also provides source code for you to edit in the browser or save to your computer to run locally.
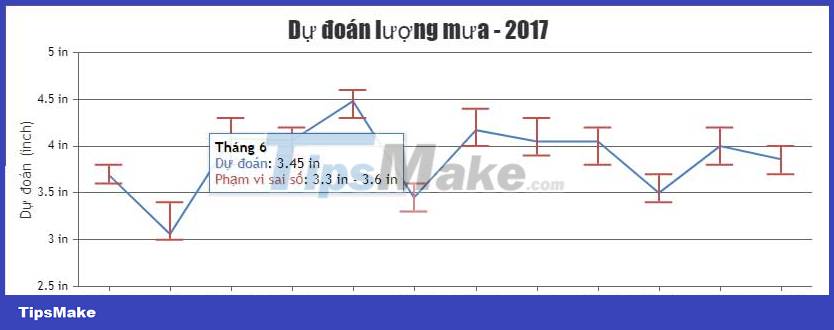
Chart customization
Like any other chart, you can adjust some properties to get the results you want. For example:
stemDashType&whiskerDashType: Change the respective strikethrough styles.lineThickness: Thickness of the line.lineColor: Color of the line.stemThickness: Thickness of the body.whiskerThickness: Thickness of the extreme point.
Was this article helpful?
Your feedback helps us improve.
Related Articles
 JavaScript code to generate dynamic line graphs/charts1 minutes read
 JavaScript code to generate error charts & graphs1 minutes read
 JavaScript code to create OHLC and line chart combo chart template1 minutes read
 JavaScript code to create a combined area and line chart.1 minutes read
 JavaScript code to create a chart/graph combining lines, areas, and columns.1 minutes read
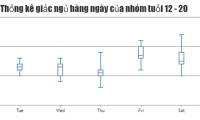 JavaScript code to generate box and whisker charts/graphs2 minutes read
Reader Comments 0
Sign in with email or Google to join the discussion.