How to Use Google Slides to Create a Diagramwhen you think of google slides, you probably just imagine something you can use to design slides for your various presentations. what you might not realize is that google slides is also great for creating diagrams, whether it's a flow chart, venn diagram, or mind map.
How to use Presenter View in Google Slidesgoogle slides, like powerpoint, has a variety of presentation modes, which can be useful when you're giving a presentation and want your slideshow to look smooth.
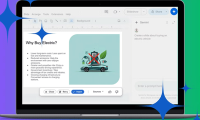
4 Useful Ways to Use Gemini AI in Google Slidespresentation slides are important, but wouldn't it be great if the process was a little easier? with gemini ai in google slides, that's possible!
10 things you can do with Google Slidesin terms of design and presentation tools, powerpoint, canva, and keynote are the most famous. but there is a versatile tool that rarely gets mentioned in the press - google slides.
How to Convert PowerPoint Files to Google Slidesboth microsoft powerpoint and google slides are useful and commonly used presentation support tools today. many people have the habit of using powerpoint, but there are also others who prefer to use google slides.
How to delete Text Box in Google Slidesusing a text box is a pretty useful trick if you want to highlight something on a slide. overusing the text box can turn your presentation into a mess.
What is Google Sites, and when should you use it?google sites is a useful application from google, but not many people know about it. if you're looking to build an intranet for your employees, a website for your family, or an hotspot for your work team, then google sites could be the ideal choice.
5 best Google Slides templates for teachersgoogle slides is one of the best and free presentation apps out there. this tool uses a simple approach that makes it quick and easy to create and present slides for teachers and education professionals.
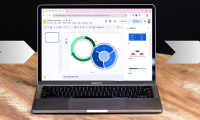
How to create a graph in Google Slidesgoogle slides' easy-to-use interface and online sharing capabilities make it stand out from other programs, and one of the many things you can create with google slides is graphs.
 How to Use Google Slides to Create a Diagram
when you think of google slides, you probably just imagine something you can use to design slides for your various presentations. what you might not realize is that google slides is also great for creating diagrams, whether it's a flow chart, venn diagram, or mind map.
How to Use Google Slides to Create a Diagram
when you think of google slides, you probably just imagine something you can use to design slides for your various presentations. what you might not realize is that google slides is also great for creating diagrams, whether it's a flow chart, venn diagram, or mind map.