Linear Regression in Machine Learning
In statistics, linear regression is an approach to modeling the linear relationship between y and x.
Table of Contents
Regression is a method used to determine the relationship between one variable (y) and other variables (x).
In statistics, linear regression is an approach to modeling the linear relationship between y and x.
In Machine Learning, linear regression is a supervised Machine Learning algorithm.
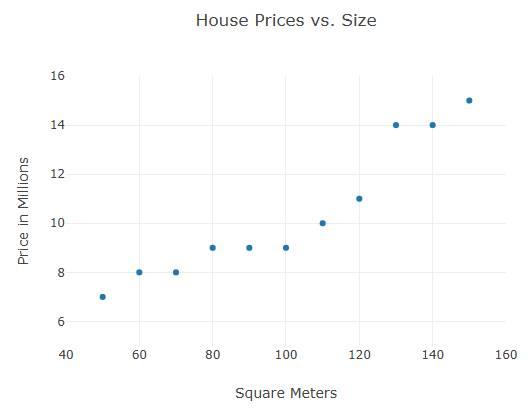
Scatter plot
This is a scatter plot (from the previous article):
For example:
const xArray = [50,60,70,80,90,100,110,120,130,140,150]; const yArray = [7,8,8,9,9,9,10,11,14,14,15]; // Define Data const data = [{ x:xArray, y:yArray, mode: "markers" }]; // Define Layout const layout = { xaxis: {range: [40, 160], title: "Square Meters"}, yaxis: {range: [5, 16], title: "Price in Millions"}, title: "House Prices vs. Size" }; Plotly.newPlot("myPlot", data, layout);Predict the value
Given the scattered data above, how can we predict future prices?
- Use hand-drawn linear graphs.
- Modeling linear relationships
- Linear regression modeling
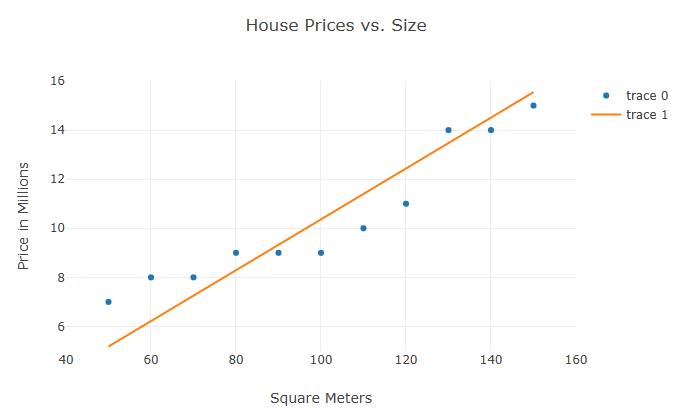
Linear graph
This is a linear price prediction graph based on the lowest and highest prices:

For example:
const xArray = [50,60,70,80,90,100,110,120,130,140,150]; const yArray = [7,8,8,9,9,9,9,10,11,14,14,15]; const data = [ {x:xArray, y:yArray, mode:"markers"}, {x:[50,150], y:[7,15], mode:"line"} ]; const layout = { xaxis: {range: [40, 160], title: "Square Meters"}, yaxis: {range: [5, 16], title: "Price in Millions"}, title: "House Prices vs. Size" }; Plotly.newPlot("myPlot", data, layout);From the previous chapter
A linear graph can be written as y = ax + b
In there:
- y is the price we want to predict.
- a is the slope of the line
- x are the input values
- b is the point where it intersects the y-axis.
Linear relationship
This model predicts price by using the linear relationship between price and size:
For example:
const xArray = [50,60,70,80,90,100,110,120,130,140,150]; const yArray = [7,8,8,9,9,9,10,11,14,14,15]; // Calculate Slope let xSum = xArray.reduce(function(a, b){return a + b;}, 0); let ySum = yArray.reduce(function(a, b){return a + b;}, 0); let slope = ySum / xSum; // Generate values const xValues = []; const yValues = []; for (let x = 50; x <= 150; x += 1) { xValues.push(x); yValues.push(x * slope); }In the example above, the slope coefficient is the calculated average value and the intercept is 0.
Using linear regression function
This model predicts prices using a linear regression function:

For example:
const xArray = [50,60,70,80,90,100,110,120,130,140,150]; const yArray = [7,8,8,9,9,9,10,11,14,14,15]; // Calculate Sums let xSum=0, ySum=0 , xxSum=0, xySum=0; let count = xArray.length; for (let i = 0, len = count; i < count; i++) { xSum += xArray[i]; ySum += yArray[i]; xxSum += xArray[i] * xArray[i]; xySum += xArray[i] * yArray[i]; } // Calculate slope and intercept let slope = (count * xySum - xSum * ySum) / (count * xxSum - xSum * xSum); let intercept = (ySum / count) - (slope * xSum) / count; // Generate values const xValues = []; const yValues = []; for (let x = 50; x <= 150; x += 1) { xValues.push(x); yValues.push(x * slope + intercept); }
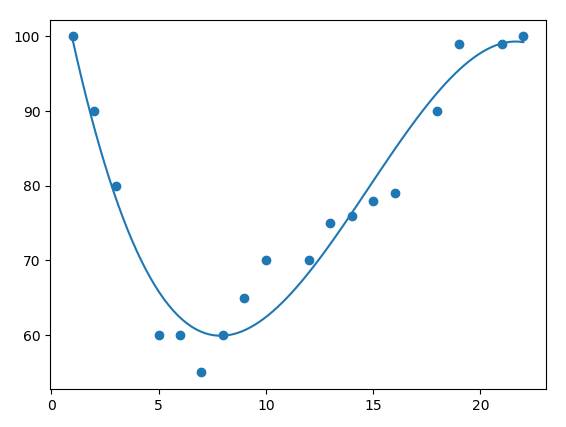
Polynomial Regression
If the data points are scattered and do not fit linear regression (a straight line passing through the points), the data may fit polynomial regression.
Polynomial regression, like linear regression, uses the relationship between the variables x and y to find the best way to draw a straight line through the data points.
Was this article helpful?
Your feedback helps us improve.
Related Articles
 Linear graphs in Machine Learning1 minutes read
 SLOPE function - The function returns the slope of a linear regression line through data points in Excel3 minutes read
 Machine Learning Terminology4 minutes read
 FORECAST function - The function returns a value along a linear trend in Excel3 minutes read
 Steps to perform Regression Analysis in Windows 11/106 minutes read
 AI and Machine Learning in the Enterprise4 minutes read
Reader Comments 0
Sign in with email or Google to join the discussion.