How to create professional Infographic by Piktochart
Infographic has now been used much to convey information under extremely vivid color charts. There are lots of tools to help create an infographic like Piktochart. This service provides users with hundreds of different templates to choose from. We can use immediately available templates that Piktochart provides, or you can style Piktochart for yourself with the tools Piktochart provides. The following article will show you how to use Piktochart to create professional Inforgraphic.
- 10 free tools that support creating simple infographic
- 12 secrets of creating Infographic 'capturing' viewers
- 8 things to note when doing Infographic
Using Piktochart to create online Infographic
Step 1:
First of all, please visit the link below to register your account using Piktochart.
- https://piktochart.com/
Click the Sign up button in the top right corner of the screen.

Step 2:
Enter the required information in the account creation interface and click Create Account below.

Then we will receive a message like the image below that needs to verify the login information via the email address entered.

Step 3:
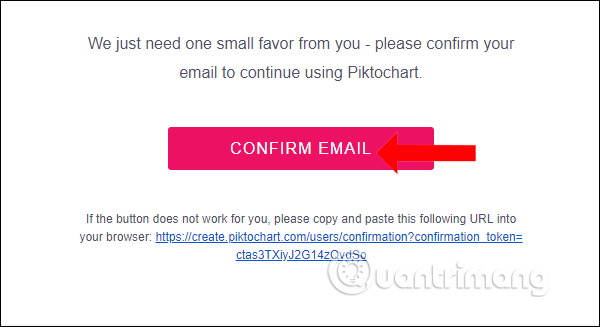
In email Piktochart sent to press the Confrim Email button to complete the registration Piktochart. Finally return to Piktochart's main page, log in to your account information.
Step 4:
At the main interface of Piktochart, click on Create New to proceed to create new graphics.
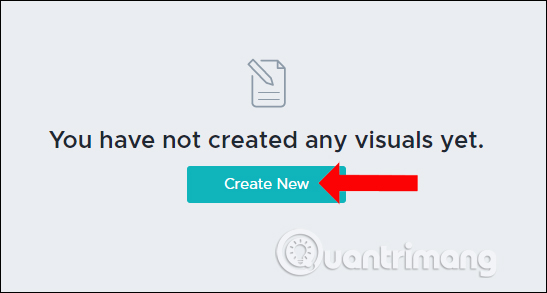
Piktochart will provide users with templates to create Infographic, Presentations, and advertisements. Click on Infographic .

Step 5:
Piktochart provides several templates for you to choose at Infographic. With a free account, the number of samples will be less than a paid Pro account. When hovering over a template you will have the option to Preview or Use Template.
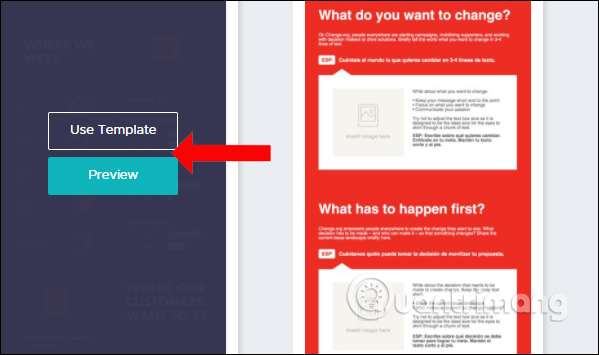
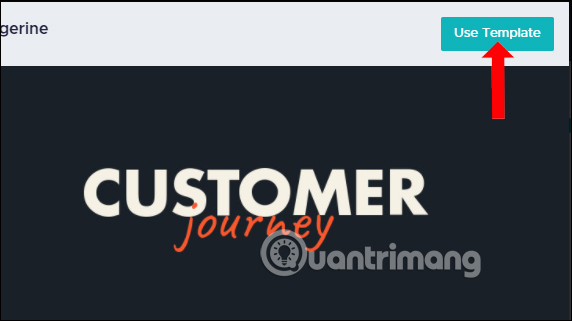
You can click Preview to see how the template is and then click Use Template to use this template.
Step 6:
With the available Infographic template , users simply enter the content into the Template template. Since Piktochart divides Infographic into different small blocks, you click on each block to edit.
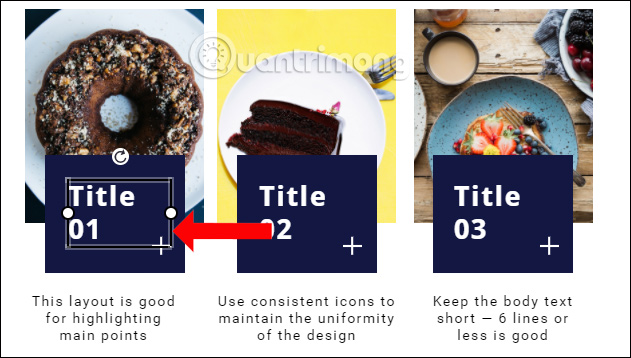
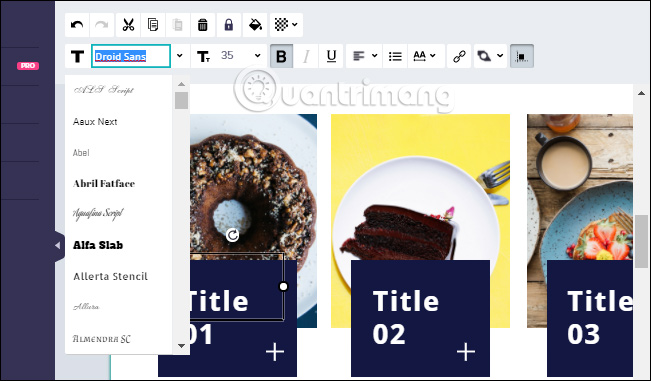
To edit the text, use the toolbar on the top.
Step 7:
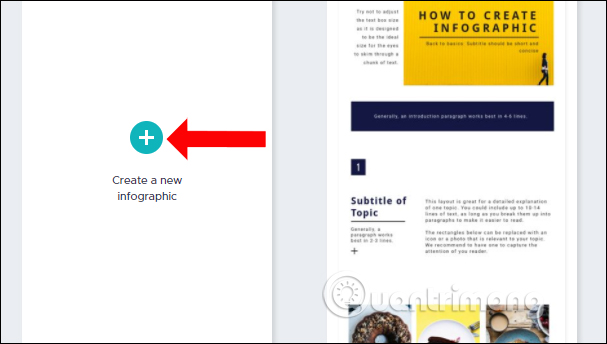
In case the user wants to create a new Infographic , click on Create a new infographic . We will be moving to a completely new interface to create Infograpahic.
Step 8:
To add content to the Infographic, use the tools on the left side of the screen. For example, to create an Infographic background, click the Background item and find the wallpaper you want to use.

Or add a block or icon to click on Shapes & Icons and select the graphics you want to add to your Infographic.
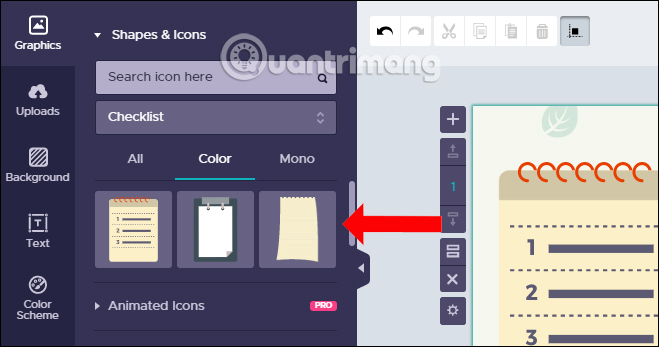
Your infographic may also contain other data such as charts, videos or maps. Click on Tools to see the content Piktochart provides.
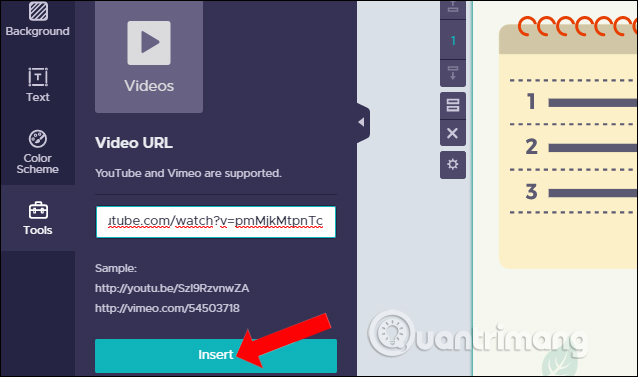
Piktochart tool supports users to insert Youtube videos and Vimeo into Infographic . You just need to enter the video URL and click Insert .
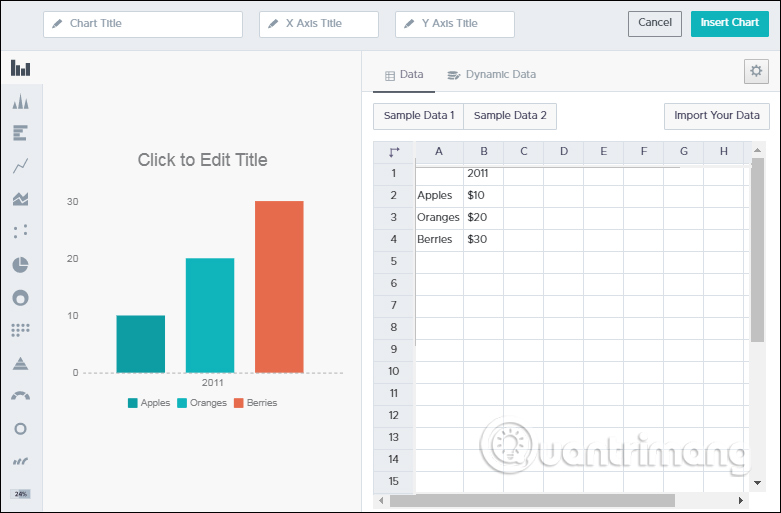
Or to insert a chart into an Infographic, click the Chart item and select the type of chart you want to insert. We only need to enter the required content in this interface to display the chart. You do not need to draw the chart yourself.
After entering the information click Insert Chart to put the chart into the content.
Step 9:
Once you've created Inforgraphic, click on the Save button above to save it.
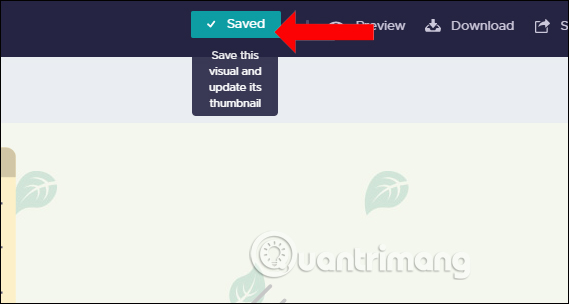
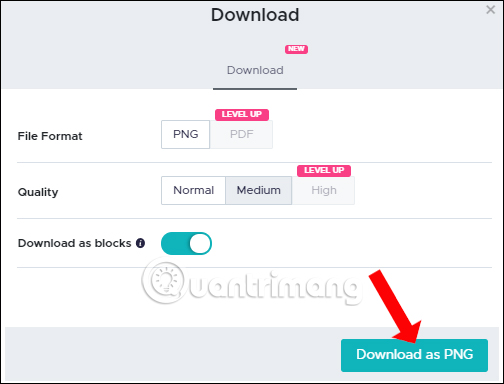
If you want to see the infographic you created, click the Preview button above. Click on the Download button above to download Infographic down.

Here, Piktochart will give free account to save Infogrpahic in PNG format with Normal or Medium quality. Finally click the Download as PNG button below to download the file to your computer, then proceed to extract the file and finish.
Overall, creating Infographic on Piktochart is very simple. Every tool created or edited appears clearly on the screen, and you only need to choose to use it without having to sit step by step. The file will be saved in PNG format and not stamped so we can use it for our work.
See more:
- 5 Infographics tricks for beginners to Marketing
- Top 10 websites provide a free Photoshop brush
- These websites provide free software for PDAs
I wish you all success!