Table of Contents
Gemini in Google Slides can generate an individual slide, create or edit an image, produce an infographic, summarize material, and suggest improvements to an existing deck. It is best used for a first draft: generated facts, charts, images, and layouts still require human review.
Feature availability depends on the Google Workspace or Google AI plan, supported language, administrator settings, and rollout. Menu labels may differ from the screenshots.
Generate a slide
Open a presentation, choose Insert, then open Help me illustrate and select Slide, if those options are available in your account.
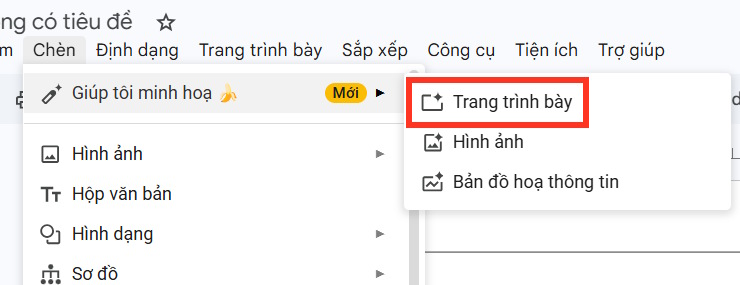
Describe one slide rather than asking for an entire vague presentation. Include the audience, purpose, message, evidence, and desired visual.
Create one 16:9 slide for a leadership meeting.

Message: Customer support wait time fell after the new routing process.
Use only the data in the attached Drive file.
Layout: conclusion headline, one line chart, and three short annotations.
Do not invent values or use decorative stock photos.
Add the source file name in a small footer.
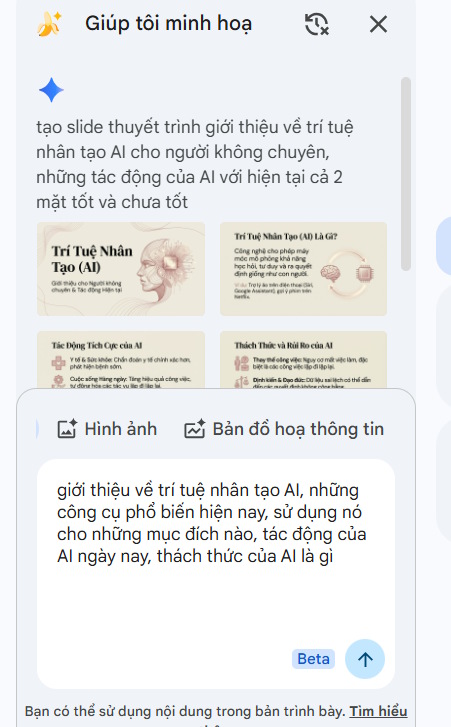
Review the proposed slide and insert it into the deck.
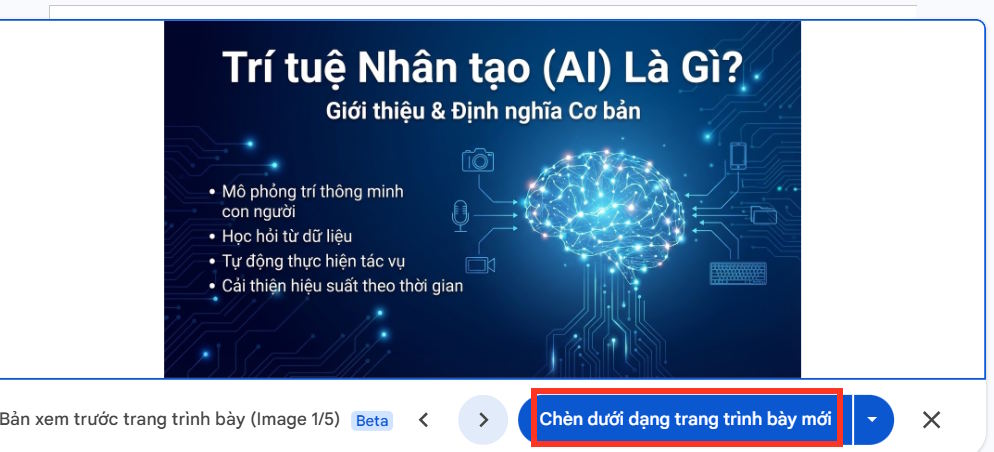
Check that the headline states the actual conclusion and that all values match the source. A polished chart can still contain invented or mislabeled data.
Edit a generated visual
Select an image or supported visual element to view available edit options.

Describe the change precisely, generate a replacement, and compare it with the original before choosing Replace.
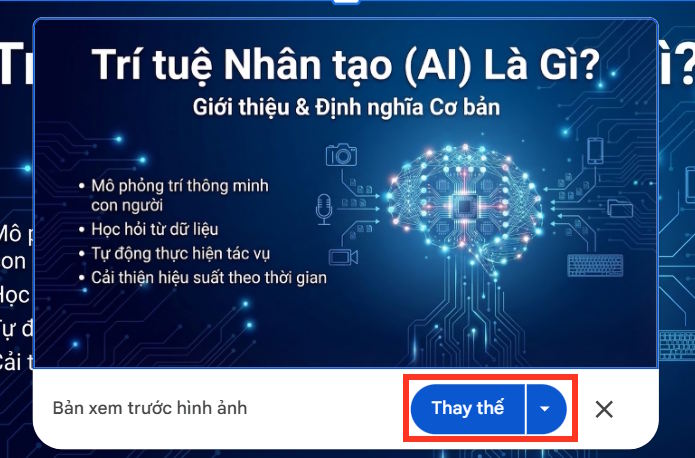
AI image editing can change more than the requested detail. Check faces, hands, text, logos, product features, and background objects.
Create an image for a slide
Open Help me illustrate, select Image, and describe the visual.
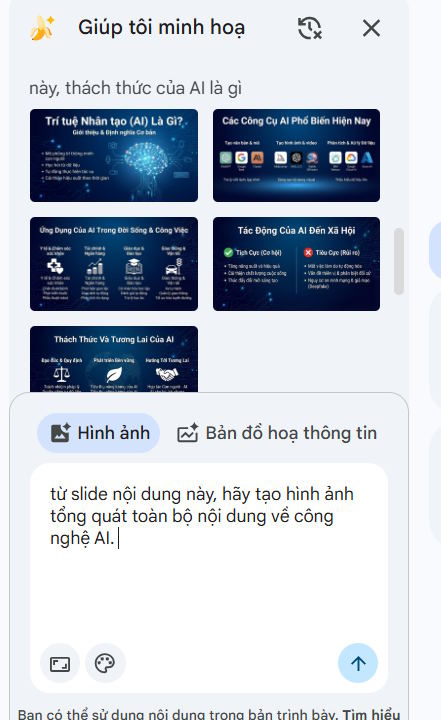
A useful image prompt specifies subject, composition, style, colors, and empty space for slide text. For example:
Editorial illustration of a small support team routing customer requests,
wide landscape composition, calm blue and warm orange palette,
simple geometric style, no text, no logos, empty space on the left for a headline.
Review the results and insert the best candidate.

Create an infographic
Select Infographic in the visual-generation area when available.
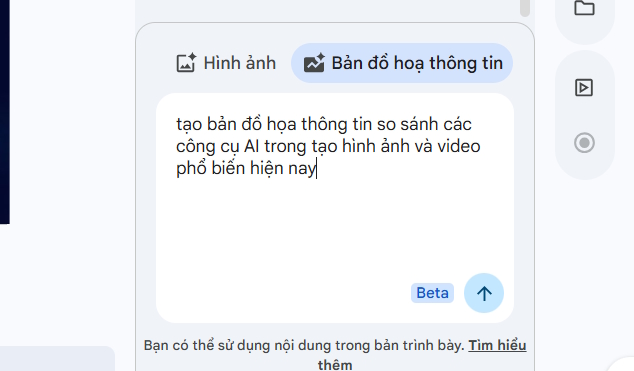
Provide a small, verified set of facts. Ask for a clear reading order and minimal text.
Create a three-step horizontal infographic.

Steps:
1. Request received
2. Routed by topic
3. Resolved by specialist

Use only these labels. Include simple icons, arrows, and high-contrast colors.
Do not add statistics, claims, or extra process steps.
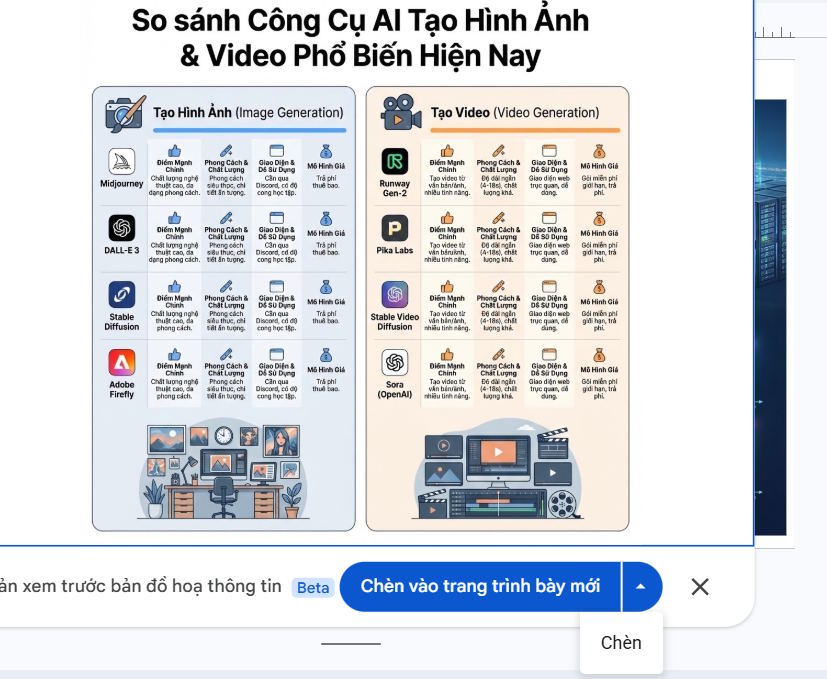
Generated text inside an image may be distorted or inaccessible. Rebuild critical labels as normal slide text so they remain editable, searchable, and readable by assistive technology.
Improve an existing slide
Select the slide, open the Slide menu, and choose Beautify this slide or the equivalent improvement command.
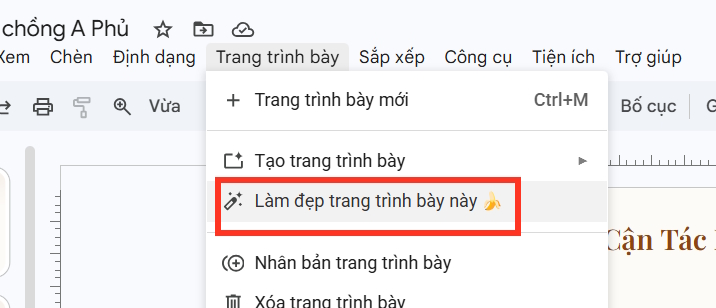
Compare the original and revised versions.
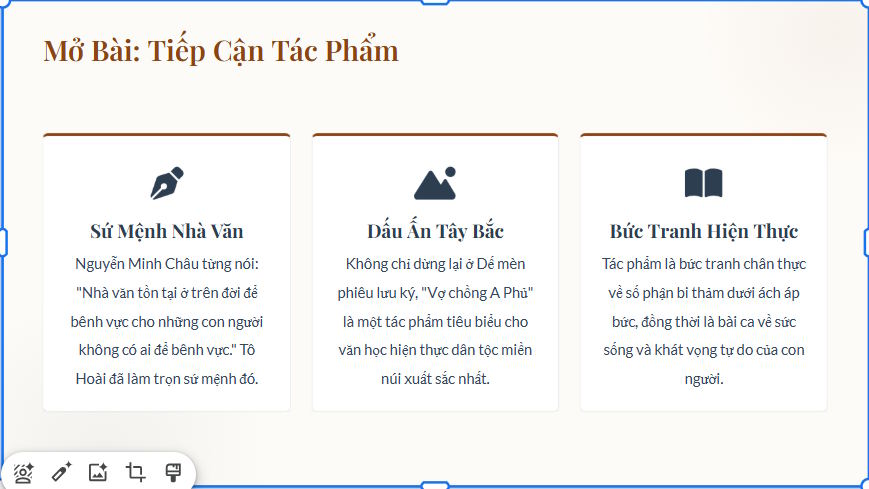
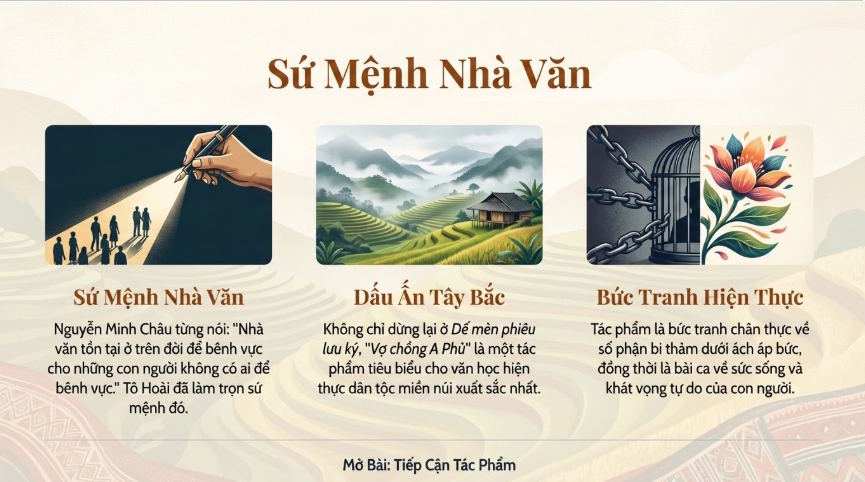
A prettier slide is not automatically a clearer one. Keep the version with better hierarchy, contrast, alignment, and reading order. Reject changes that remove qualifiers or turn real data into decorative shapes.
Use the Gemini side panel
Open the Gemini icon in Slides to ask questions about the deck or connected sources available to your account.
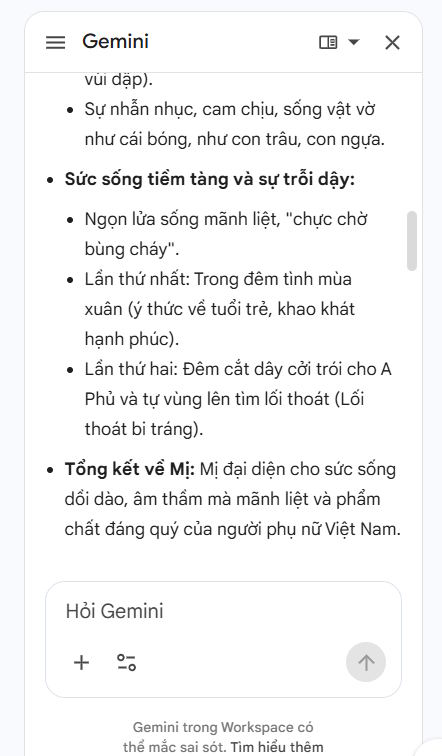
Useful requests include:
- “List slides that repeat the same claim.”
- “Summarize the presentation in five bullets for speaker notes.”
- “Identify terms that are not defined for a general audience.”
- “Using the attached Drive file, flag any numbers in this deck that do not match.”
- “Suggest a clearer order without rewriting the source facts.”
How to prompt for a stronger slide
Use this structure:
- Audience: who will see the deck;
- Decision or learning goal: what they should understand or do;
- Source: the file or verified facts Gemini may use;
- Message: the conclusion the slide should communicate;
- Format: chart, comparison, process, timeline, or image;
- Constraints: word count, brand colors, required labels, and prohibited additions.
Final review checklist
- Every statistic and quotation matches an authoritative source.
- Charts use the correct values, units, scales, and dates.
- Generated images do not misrepresent a real person, place, product, or event.
- Text remains editable and readable at presentation distance.
- Color contrast and reading order are accessible.
- Speaker notes contain explanation that does not fit on the slide.
- The deck follows one visual system instead of a different style on every slide.
- Private Drive content is not exposed to unintended collaborators.
Gemini can accelerate slide creation, especially for individual layouts and visual concepts. The quality of the presentation still depends on the source material, the clarity of the message, and a careful review after generation.
Related Articles
 How to Create Infographics with AI Simply: Step-by-Step Guide7 minutes read
 4 Useful Ways to Use Gemini AI in Google Slides6 minutes read
 A Guide to Creating Presentation Slides Quickly Using Gemini4 minutes read
 Guide to Designing Lecture Slides Using Gemini4 minutes read
 Powerful Support Utilities for Google Slides5 minutes read
 How to Create Visual Lectures with Gemini Canvas4 minutes read
Reader Comments 0
Sign in with email or Google to join the discussion.