Want to create a perfect infographic, please refer to this advice from experts
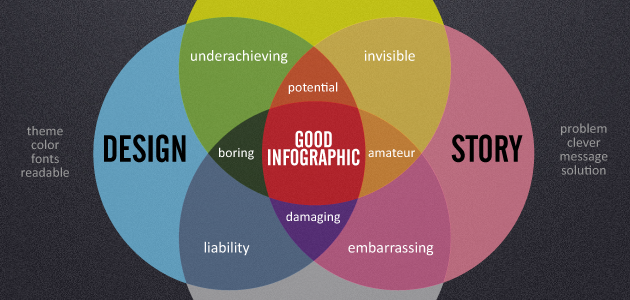
Infographic is a combination of information and graphics about a certain field, problem, or advertising campaign. The information in the infographic is explained in an intuitive way through the images. The main purpose of infographic is to 'turn' a complex topic into simple images that help viewers easily access and remember information.
Table of Contents
Infographic is a combination of information and graphics about a certain field, problem, or advertising campaign. The information in the infographic is explained in an intuitive way through the images. The main purpose of infographic is to 'turn' a complex topic into simple images that help viewers easily access and remember information.
If a perfectly designed infographic will help increase inspiration and motivate viewers to act on the information it conveys. So how can you design yourself a perfect infographic, you can refer to some of the following tips of experts.
1. Focus on the data
- Use relevant data.
- Use reliable sources.
- Check if the data is correct - "If the data you use is not reliable, then the infographic you create is also a bit of a waste", according to Tiffany Farrant-Gonzalez.
- Only use the data related to the content you create on infographic - "A perfect infographic that allows viewers to capture the main content" , the Stevology.
- Add your sources.
2. Clear design graphics
- Limit the use of color palettes.
- Use simple illustrations.
- Use data visualization to illustrate the most obvious data (on infographic using only 53% data visualization).
About Data Visualization, it can be understood as a form of presentation in the form of images or graphics.
- Transfer messages only in "wink" - "Mix all the data or concepts and cook them up into a single photo ", according to @mvolpe.
- Establish the connection between the parts (a perfect infographic will display the information in a sequential way, there is a connection between this section and the other so the reader can capture the correct information Best).
- Make sure the graphics illustrated and the numbers are matched.
- Limit width to 735 pixels (standard size).
- Anything that exceeds 5000 pixels does not get the attention "A large infographic will be considered imperfect", according to TDefren.
3. Share stories
- Answer an interesting question to 'suck' readers - 'A perfect infographic usually starts with the question' why ' , according to ConversationAge.
- Using logical data to 'elicit' emotions wants to be answered (infographic attracts almost 450% of 'actions', more than article types).
- Graphics must tell the story of the story - 'A perfect infographic can express the meaning and content of the story immediately ', according to @Jowyang.
- Use as few words as possible, and use the best looking fonts - ' Imagine if your infographic has about 1000 words, it means you have lost points' , according to @mikemacfarlane.
- Create files as small as possible (compress images in .jpeg format) without losing accuracy.
- Don't forget to sign with an embed code.
Refer to some of the following articles:
- 8 things to note when doing Infographic
- 10 free tools that support creating simple infographic
- 12 secrets of creating Infographic 'capturing' viewers
Good luck!
Was this article helpful?
Your feedback helps us improve.
Related Articles
 Steps to create an infographic on Canva6 minutes read
 Without a 6-zone appearance, men can still attract women in the following ways5 minutes read
 Top 10 websites to create beautiful infographics4 minutes read
 How to create the most beautiful and creative infographic5 minutes read
 5 Infographics tricks for beginners to Marketing6 minutes read
 'Just use Linux' is no longer useful advice7 minutes read
Reader Comments 0
Sign in with email or Google to join the discussion.