How to create Infographics with AI simply
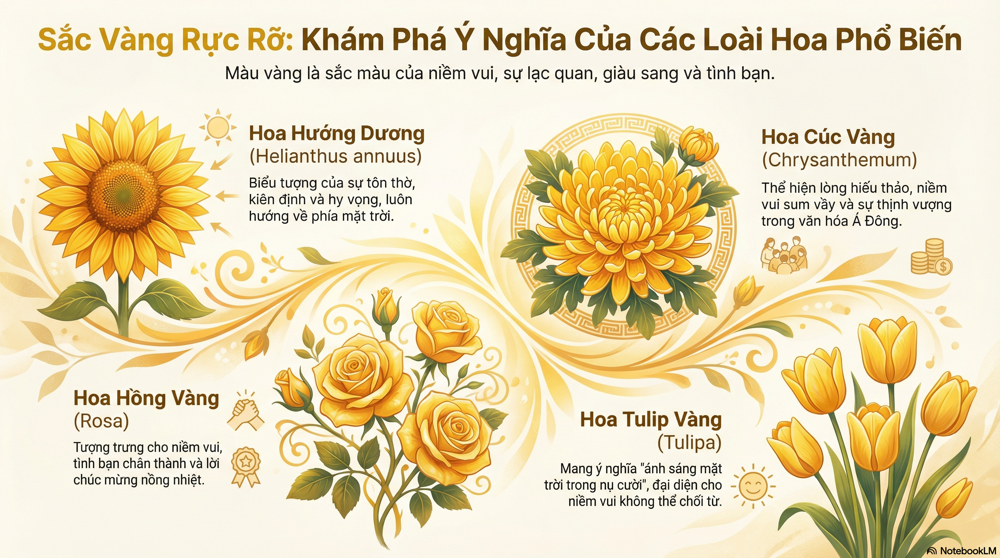
Infographics - Information graphics have become an indispensable tool for summarizing complex information in a visual and engaging way..
In the era of visual communication, Infographics have become an indispensable tool to summarize complex information in a visual and attractive way. Google's NotebookLM tool , integrated with the power of Generative AI, provides a breakthrough solution to help users (especially education and marketing professionals) create high-quality infographics quickly.
Here is a standardized, proven, and optimized process to maximize NotebookLM's potential.
1. Concept of Inforgraphics by NotebookLM AI
NotebookLM uses a large language model (LLM) to deeply analyze the source documents you provide. Instead of just generating a random image, the system performs Data Generalization , extracting key data points and transforming them into a visual structure. Understanding this mechanism helps you provide more accurate sources and statements.
2. How to create professional Infographics with NotebookLM
This process is arranged in an optimal sequence to ensure accuracy and efficient output.
Step 1: Enter information to create an Infographic on NotebookLM
- System Access: Open your browser and access Google's NotebookLM tool at the link: https://notebooklm.google.com/
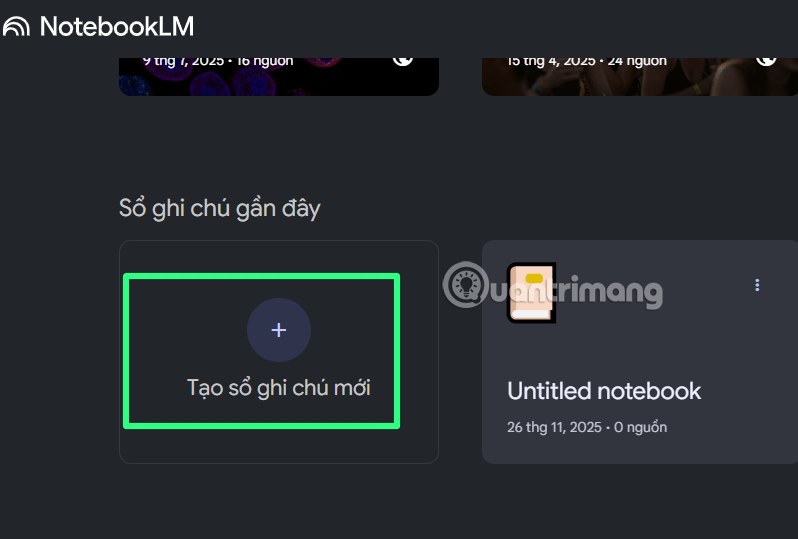
- Create Notebook: Select the 'Create New Notebook' option . This is the Digital Workspace where all your source documents and content creation sessions will be stored.
Step 2: Enter the data source you want to create Infographics from.
This is the most important step that determines the quality and accuracy of Infographics.
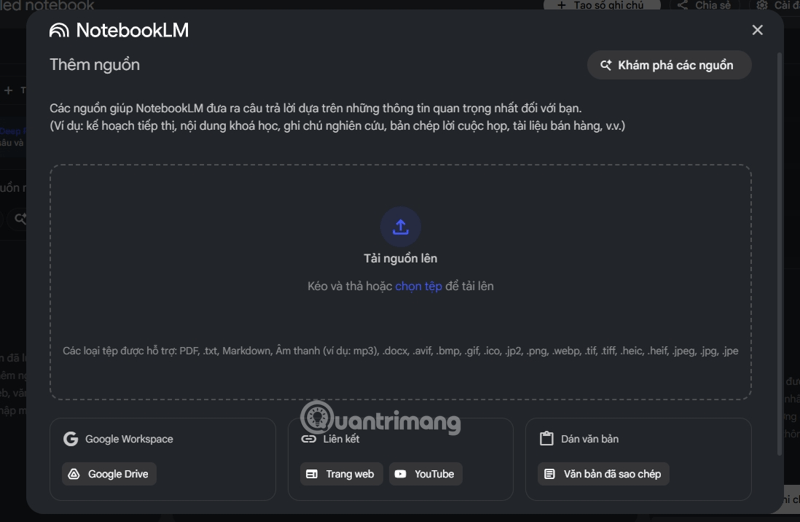
Enable Source Input: When the 'Add Source' panel pops up, proceed to insert the data that needs to be visualized.
Supported Formats: NotebookLM supports a variety of inputs for Multimodal Processing :
- Use content uploaded from Google Drive: Including content from document files such as Word, Excel, PP, TXT, images, PDF.
- Links (URLs): Paste links to articles, studies, or reputable websites with clear, visual content. Even YouTube videos with specific content.
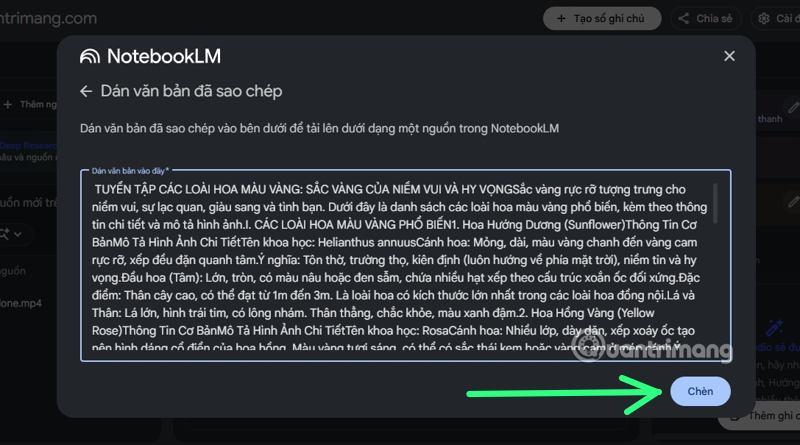
- Text Paste: Paste text, this is the simplest way for you to use the Infographics creation tool.
Source Management: You can add multiple sources. These sources will be displayed and managed in the left column of the screen, with a standard account having 50 sources and with a Pro account having 300. Once done, click 'Insert' .
Step 3: Configure and execute the command to create the Infographic
-
After completing the information entry to create Infographics, in the Studio column on the right side of the interface, select the 'Infographics' function.
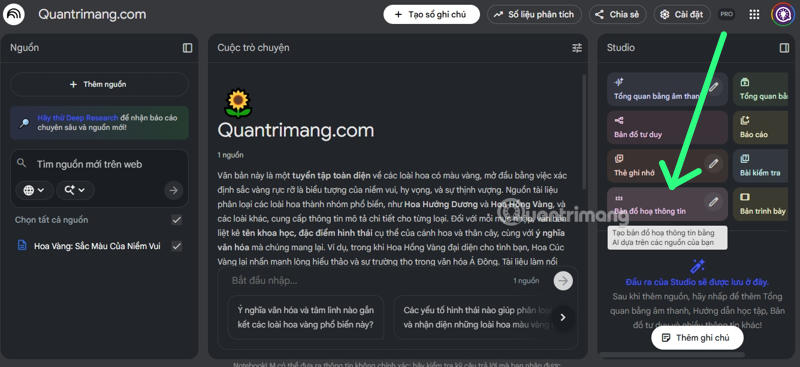
Refine the request: This is the step to control the AI output. Click the edit icon (pencil) next to the Infographics function. Then, enter the custom command in professional syntax:
- Recommended structure: Create an infographic on the topic [Topic name] in the style [Modern/Minimalist/Historical/Mythological/Modern Technological World]
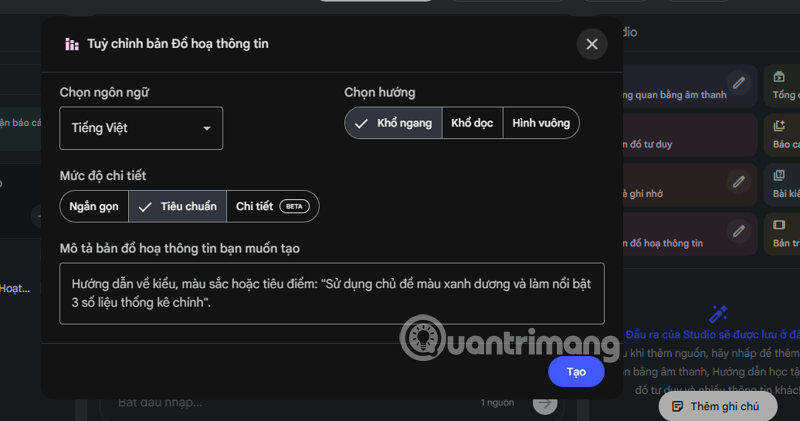
Output Control Note: If you want the Infographics to be strictly faithful to the source content without any AI additions or interpretation, emphasize this in your command (e.g. 'Use exact data from the provided source document' ).
Wait for System Generation: After entering the command, the system will proceed with the Data Processing & Image Generation process .
Step 4: Quality Control of Infographics
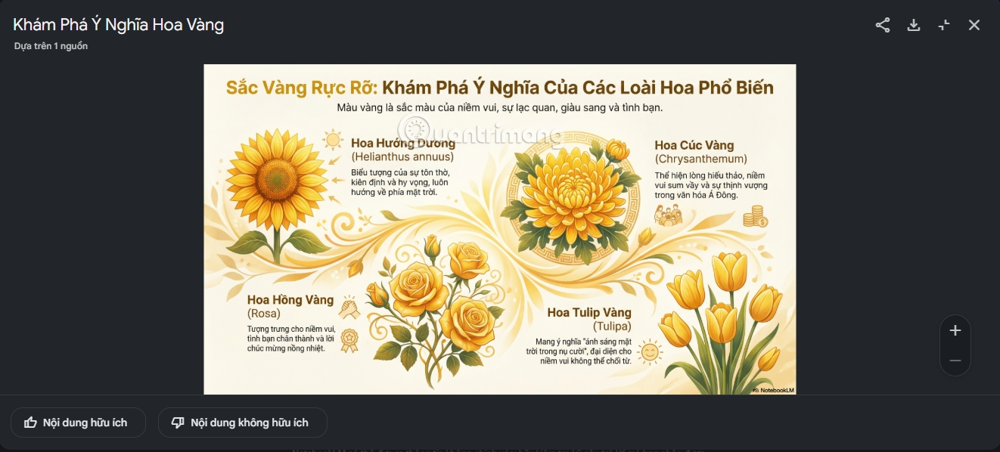
- Output Evaluation: Once the AI is created, click on the image to view the Infographics.
- Data Validation: This is a MANDATORY step . Since data-generated AI can still make mistakes or misinterpret context, users must carefully review all figures, names, and logical relationships in Infographics against the original source material.
- Publish: After confirming the accuracy, click on the option to download the image to your device and use it.
To optimize your Infomap, control the Quality of your input data sources. The content you provide to NotebookLM to create Infographics must be accurate and of high quality to produce an Infomap. Provide documents that are clearly structured, use technical terminology, and focus on the data you want to visualize.