12 secrets to designing impressive infographics that captivate viewers.
What are the ideal infographic sizes to make an impression and attract viewers? This article will provide you with the best infographic design tips..
What are the ideal infographic sizes to make an impression and attract viewers? This article will provide you with the best infographic design tips .
Infographics are an engaging format for visual content that you can use to expand and add interest to your marketing communications 'toolbox'. After all, the goal of content marketing is to inform, educate, or entertain your audience. And what better way to achieve this than with a surprisingly useful tool: infographics?
But what exactly is an infographic?
Infographics – at its most basic level – is a visual story. But we're not talking about an 800-page novel. This is a story told through images and easily understood, with minimal text, like that favorite childhood book you haven't read in decades but still remember as if it were yesterday.
Infographics are used to convey your brand story or the compelling data you've gathered from your latest research, in a format usable on your website, social media, or even in ebooks.
Infographics are no longer something extraordinary. Anyone can create their own, and this tool is especially popular among designers. However, not everyone can create impressive infographics.
Here are 12 things to remember when designing infographics.
1. Targeting the ideal user (target audience)
Having an infographic design idea means you're halfway to creating an impressive product. And the best way to do this is to take the time to analyze the needs and desires of your audience.
Infographics that generate significant traction, attract attention, and go viral are those that meet the greatest needs of their target audience.
However, a very common mistake among beginners in infographic creation is that they often overlook or misunderstand the needs of their audience. Instead, they focus on common needs – those that appeal to the majority of users – without targeting their specific customer base.
Remember that the goal of creating an infographic is to convey your company's, product's, or personal brand's message to a specific target audience, not necessarily to the whole world. Therefore, be specific, relevant , and focused.
2. Simple
One of the advantages of using infographics is that they can condense complex ideas and improvements into a very simple, easy-to-understand visual format.
However, this very advantage can also become your "Achilles' heel" if you become too complacent. An infographic can become unnecessarily complex, overwhelming the reader's mind with too much information to absorb, rather than helping them understand the message after just a few seconds of looking at your product.
Like many other formats, infographics are only great when they are simple, not too informational , and not too long. Ideally, a maximum of about 5 infographics per article/campaign/project is best.
Simplicity will prevail. It always will.
3. Focus
As discussed above, simplicity ultimately means focus. Don't create infographics overflowing with data and facts; instead, maintain focus and coherence around a single theme.
An infographic doesn't mean you have to cram all sorts of random data into one piece. On the contrary, it should convey a specific message.
4. Visualizing information
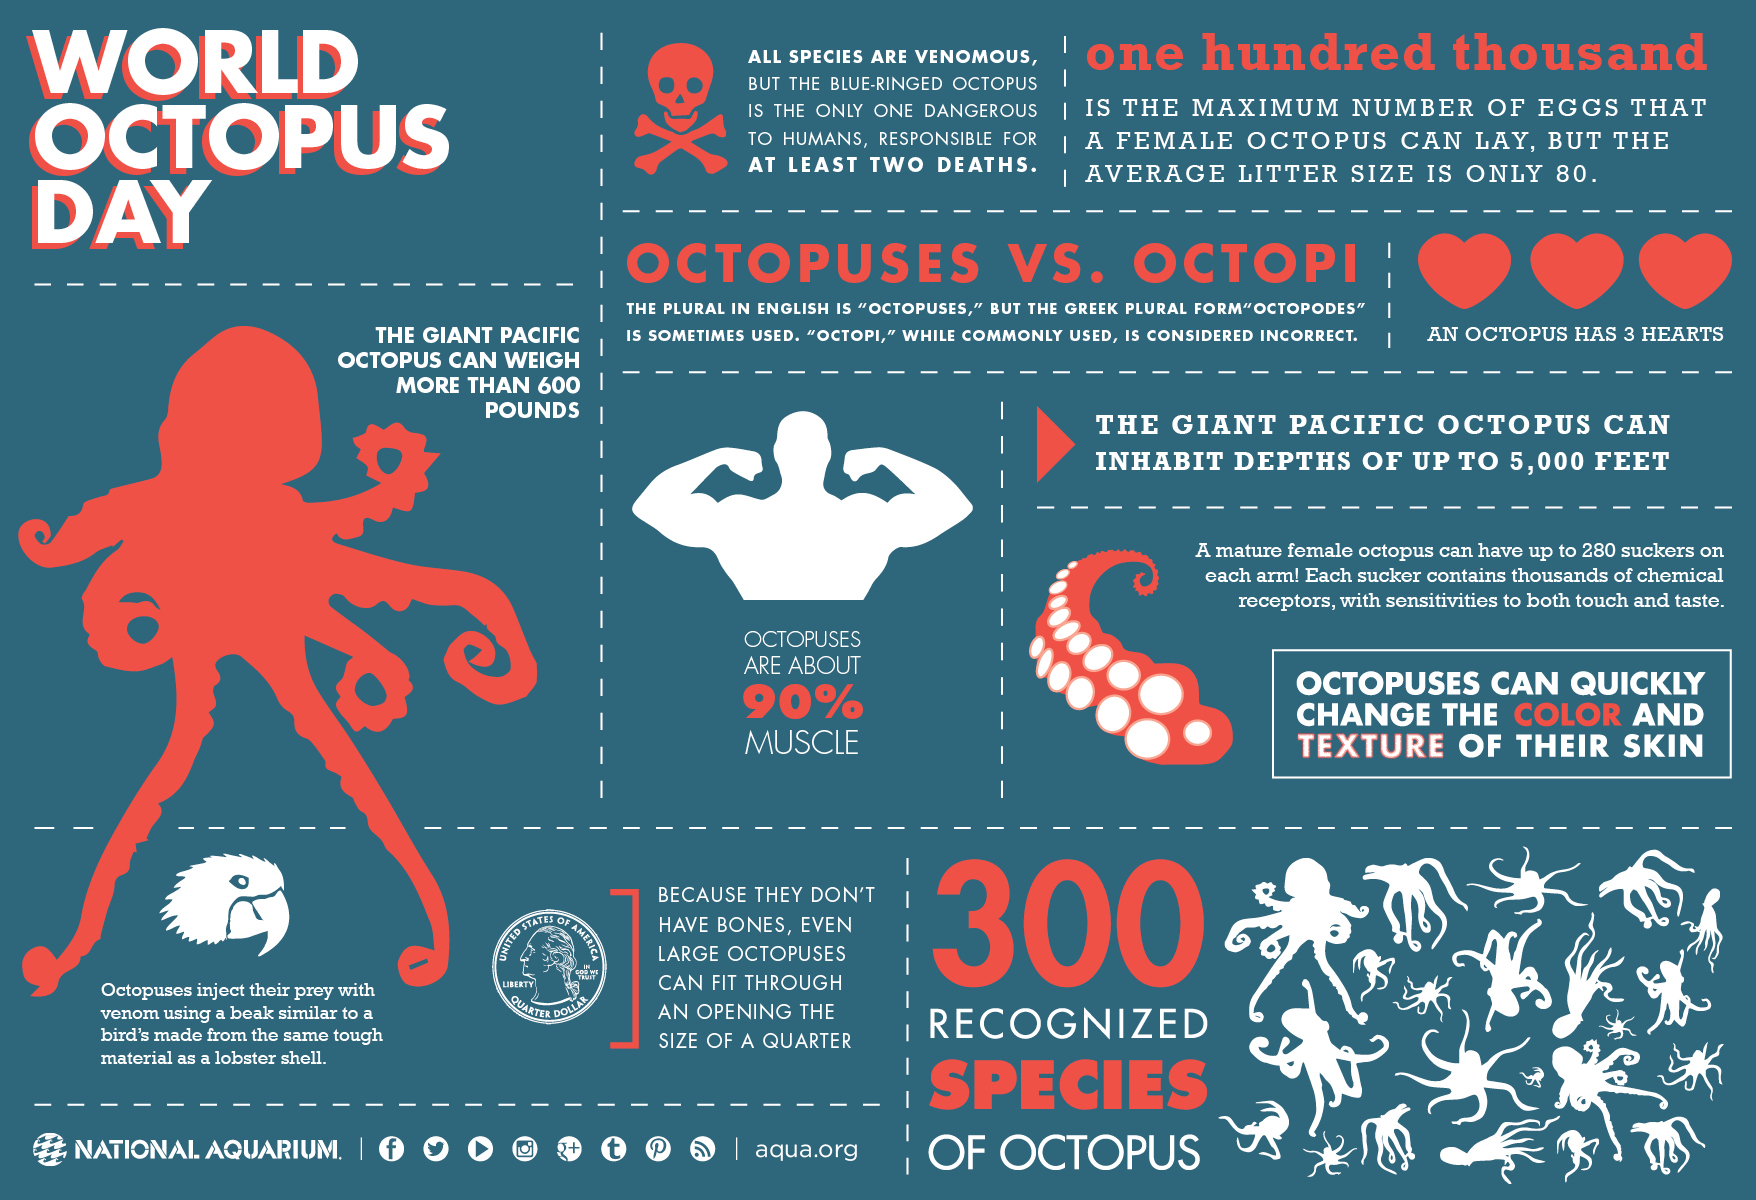
Many infographics suffer from a serious flaw: they contain too much information without fully utilizing the power of graphics. The most impressive infographics are those that strike a balance between visual information and written information.
5. Promote it.
Infographics don't spread automatically. Therefore, if you want your product to truly go viral and be known by more users, you have to promote it.
Infographic advertising is similar to other content types, such as adding social media sharing buttons below the article to encourage user engagement. Additionally, you should explore niche markets and thoroughly research user needs to create a unique selling proposition for your product.
Don't let your infographic get lost in the crowd too soon; promote it to your audience.
6. Easy to watch
The size of the infographic is also something you need to pay attention to.
Many designers create infographics that are quite large. Therefore, when they are sent to the development department, developers are forced to reduce their size to fit the user interface. This process often results in infographics losing their readability.
The next mistake is the font size; using too many fonts, with some large and some small, without harmony, makes the infographic look cluttered and aesthetically unappealing.
Therefore, when designing infographics, you need to pay attention to viewability and readability, ensuring that users can still understand your content even without zooming in. Ideally, an infographic should have a width of 600 pixels.
7. The length and width of the infographic are controllable.
Infographics can be large if the images are high-resolution. However, if they are too large, users will lose patience when loading them.
Therefore, keep the length limited to around 8,000 pixels. If it's larger, try estimating the user's attention span to choose a suitable size.
Along with that length limit comes a data limit. To account for slow internet connections, you should maintain a speed of 1.5MB.
8. Add spaces
Infographics are a useful exercise for practicing graphic design. Any graphic designer will tell you that white space is very important.
A good infographic design should strike a balance between visual elements and "negative space" to enhance the symmetry of the layout, making the product look cleaner and more natural to the viewer. Negative space doesn't necessarily have to be white; it simply means it's empty of any content.
9. Catchy title
The title of an infographic is extremely important. This principle is the same as when you write a blog post. An infographic won't attract attention if you don't have a compelling title.
A good headline will include the following characteristics:
- Describe the content of the infographic.
- It attracts the user's attention.
- Short enough to be understood when users skim through. 70 characters is a good option.
Without a strong title, an infographic won't get many views, and of course, your goal will fail.
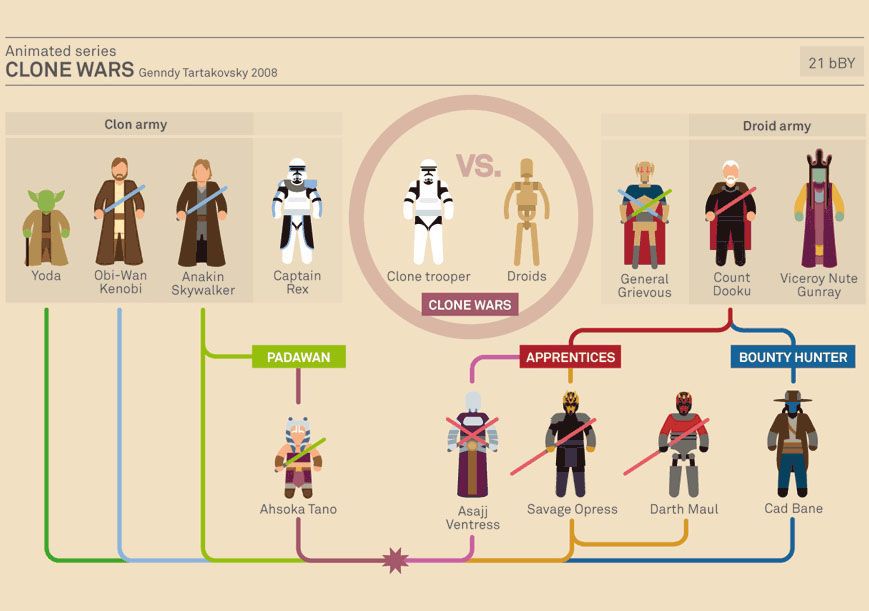
10. Fluent
The greatest strength of infographics is their ability to create a seamless connection, both cognitively and visually.
An infographic is like a story. It can convey a message by smoothly and continuously guiding you from one section to the next. All the dots are connected, and all the ideas are unified.
The ability to shift the viewer's mind during the thinking process is what creates power. However, some infographics fail to do this because the designers simply include too much information, making the infographic cluttered.
When creating an infographic, aim for a flow, or more accurately, a process. This process will help users maintain focus and remain convinced by the message you've conveyed.
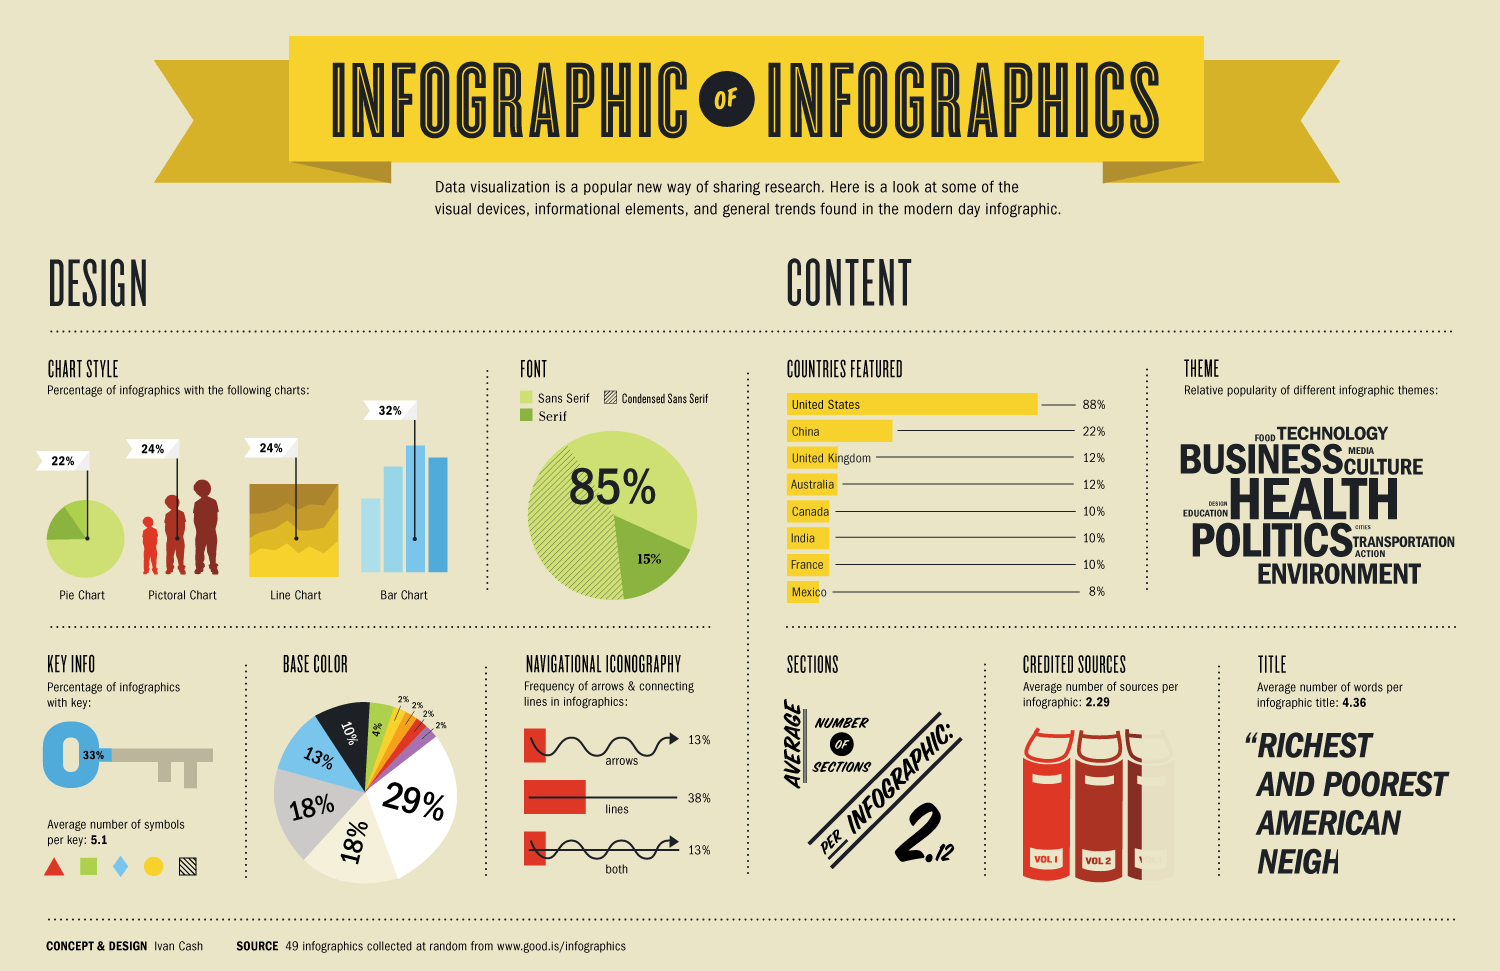
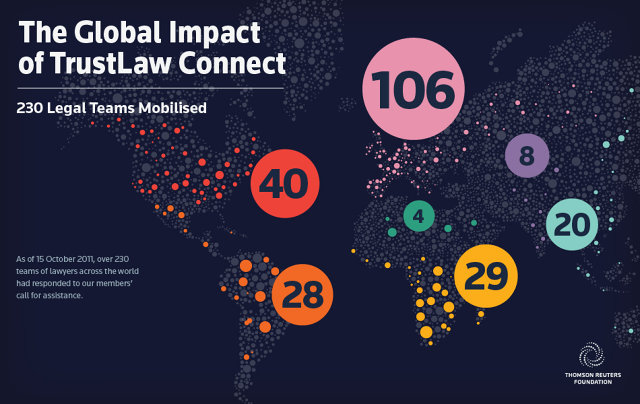
11. Check the facts and figures.
Many infographics focus on presenting data. That's a smart idea. Our minds can process data visually better than just looking at numbers with decimal points and symbols.
However, make sure your data is accurate, from a reliable source, and that you clearly label the numbers on the graph.
If your infographic contains a lot of numbers and data, take the time to double-check it before sharing it with users.
12. List the sources.
Wherever you source your data, please mention it. That's the principle.