11 free tools that support creating simple infographic
Venngage is a great tool for creating and publishing infographic. The reason is quite simple because the tool is very simple and easy to use. You can choose from templates, themes, hundreds of charts and icons as well as upload your own images and wallpapers, or customize a theme to suit your brand.
Table of Contents
In addition, if you want to create Infographic "attracting" more viewers, you can refer to the steps taken here.
1. Canva Infographic Maker
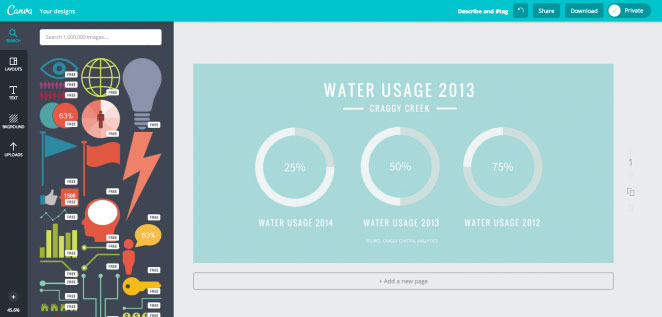
Canva is a "powerful" and easy-to-use online tool, suitable for all design styles, from brochures (1 type of advertising publication) to presentations (presentations), .
In addition, the tool also includes a large library containing hundreds of images, icons and features for you to freely choose. And the features for creating infographic are features you can completely use for free, with hundreds of free designs and fonts.
If the free library is not enough, you can use hundreds of other designs, fonts and special elements for $ 1. You can use the browser tool or download the Canva application for ipad to design when away.
Similar to other presentation creation tools, you can start with a template. Then, arbitrarily change any text, delete any image or move any icon to suit your needs. You can even add your own images as logos into infographic.
The simplicity of the application is also its limitation. If you find a suitable template, everything will be 'smooth sailing'. Edit text, move every object in the infographic within a day. If not, you may have to create infographic from scratch - a time-consuming and difficult process. If this is the case, you should consider the alternatives below.
2. Vizualize

Vizualize focuses on designing job application forms.Here, you can create your resume in one click and preview what your profile will look like.
The tool that allows people to show their professional achievements with simple designs that focus on individuality, this is really a place for you to start your personal career and also a way to create Impressive for employers.
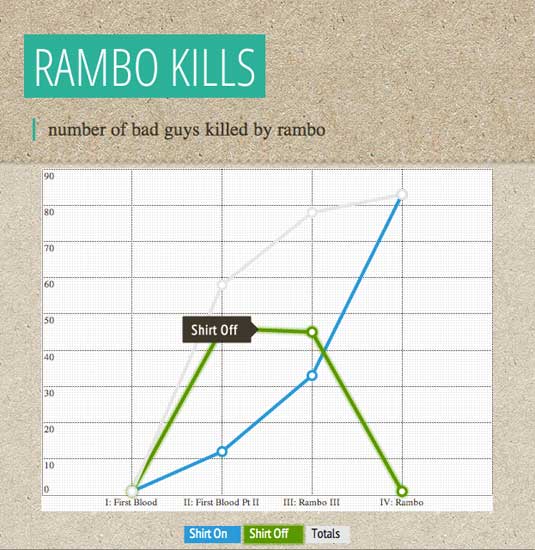
3. Google Developers
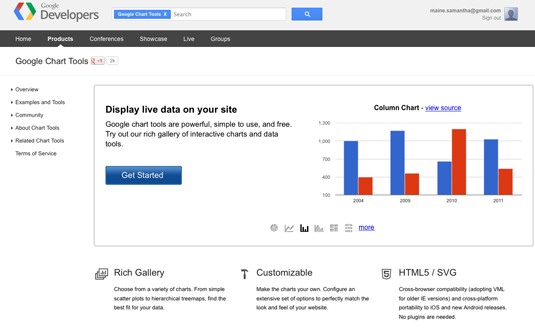
Google's charting tool is quite powerful, easy to use and also a free tool. You can choose a chart from a variety of charts and configure options to match your site. By connecting data in real time, Google Developers is the perfect infographic tool for your website.
4. Easel.ly
This free web-based infographic tool gives you "dozens" of free templates to use and you can easily customize these templates to suit your purpose.
You can access the library containing icons such as arrows, shapes and links, and you can customize the text by doing a variety of fonts, colors, text styles and text sizes. It also allows you to upload your graphic and location with just one touch.
5. Piktochart
Piktochart is an infographic tool and presentation tool that allows users to transfer boring data to an attractive infographic with just a few mouse clicks.
Users can choose their own theme and font color, insert existing images and upload their own shapes and backgrounds. The grid pattern can also be easily rearranged and resized to fit the corresponding image. With a free account, you are provided with 3 basic templates.
In terms of performance, Piktochart is in the middle of Canva and Visme. Piktochart's editor is flexible and has more features. Although there is a block system, Piktochart does not have a block-based template collection. They are only useful in dividing sections and easily changing the background of specific sections only.
However, Piktochart really 'shines' when it comes to design and aesthetics. You can create interesting infographic with Piktochart's templates. Both the template and Piktochart's interface are more beautiful than Visme. Piktochart's templates will give your infographic a professional look as if they were created by a professional designer.
But because Piktochart doesn't have a block-based collection, you have to manage it yourself. If you enter a template into Piktochart and don't like some of it or they don't meet your needs, you'll have to create everything from scratch.
However, there are a few tools to make up for this shortcoming in Piktochart. After creating an empty block, you can use the Photo Frame tool to add images to a circle or stylized frame. The extensive Chart tool will help you visualize infographic in many different ways.
The free Piktochart package allows you to download infographic in PNG format (you can also download individual blocks). Alternatively, you can register for a Pro account to access more templates and options for $ 25 / month or $ 169 / year. The Pro package allows you to download infographic in PDF format, unmarked and access to more than 800 templates.
6. Infogr.am
Infogr.am is a great free tool, offering users a variety of graphs, charts and maps. In addition, the site also allows users to upload images and videos to create infographics at their disposal.
Infogram is an extremely powerful visual tool. But the free package limits the export options. The free Infogram package only allows you to embed infographic on your blog, along with the watermark Infogram. You can download infographic in image or PDF format.
If you don't like this limit, sign up for an Infogram account and start creating an infographic by creating an empty canvas or choosing a template. Use the left bar to navigate through all the templates available for charts, text and graphics. With just one click, you can import the desired chart. Then, use the right toolbar to add data, edit the style, and choose the right location.
Infogram templates are pretty basic. The Infogram is best used as a data visualization tool. If you run a blog, create images like animated or interactive graphs, then embed them in the article to appeal to the audience.
Of course, you can use other tools to create charts. The modification of the infographic data that takes place in the Excel-style interface and the tool will automatically change the infographic accordingly.
When you feel 'satisfied' with the product, you can publish it on the Infogram's public page for everyone to enjoy, embed in the website or share on social networks.
For $ 19 / month, you can create private projects, download images and access more than 100 premium templates.
7. InFoto Free
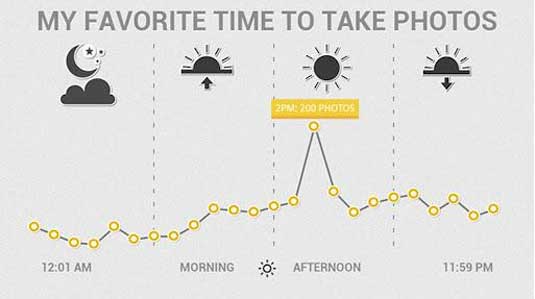
If there are many images on your Android phone, you should try using the tool to check. InFoto takes EXIF data in images and creates infographic about photography habits. The tool has a great interface, and the paid version without ads only costs 99 cents.
8. Venngage
Venngage is a step up from Canva. Although there is no block system like Visme, Venngage has a wealth of tools for adding text, photos, graphics and charts.
Venngage is a great tool for creating and publishing infographic. The reason is quite simple because the tool is very simple and easy to use. You can choose from templates, themes, hundreds of charts and icons as well as upload your own images and wallpapers, or customize a theme to suit your brand. You can also make short animated clips.
You can choose a template to edit or start with an empty canvas. To make editing infographic easier, you can group the components and 'lock' them back. Using the group feature, you can duplicate the function of a block. This helps you visually distinguish different parts of the infographic.
To create new sections for infographic, use one of the sections from the left bar to get started. You can add icons, charts, maps, photos, etc. to the infographic.
9. Dipity
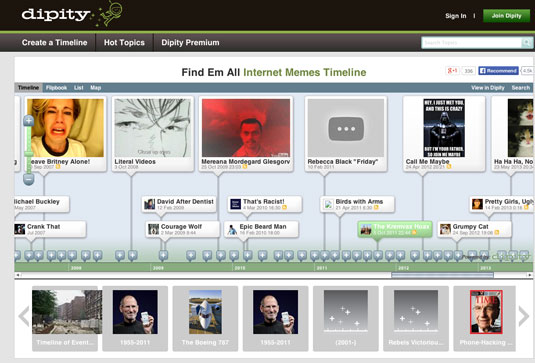
Dipity is one of the great solutions to create, share, embed and collaborate on a compelling timeline and integrate video, audio, images, text, links, social networks, taste location and timeline.
You can join for free but a premium account gives you the ability to brand custom, wallpaper, analytics, and iPhone apps.
10. Get About
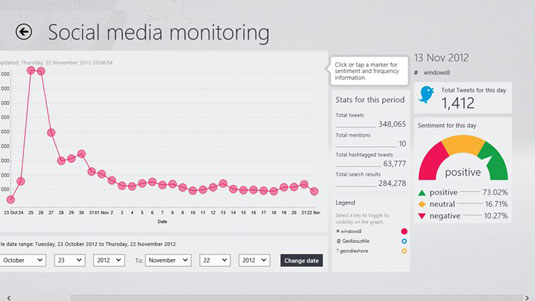
This free Windows application allows you to monitor activity on your social networks and create infographic that helps you visualize how you connect and share in your friends network.
11. Visme
If a simple template doesn't meet your needs, try using Visme. Visme has a versatile infographic tool built on the block system. After logging in, you can browse the collection of templates and see if anything stands out.
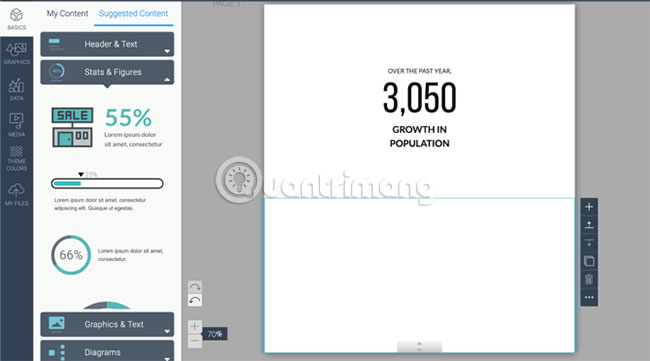
But the best way to approach Visme is to create your own infographic from scratch using blocks. The chance of finding the perfect infographic template is much lower than finding an appropriate infographic block.
After you have created a blank template, go to the Suggested Content section to browse for blocks for titles, statistics, metrics, graphics, diagrams, etc. When you see something interesting, You just need to click to add it to the block. Then you can resize and edit that element.
You can also enter elements created from other applications and websites. For example, you can use one of the best free online diagram creation tools to create flowchart, then import it into Visme.
If you don't want to create an entire infographic from scratch, don't worry. Each template in Visme is built on the same block. So it's easy to delete and edit parts of infographic by changing the blocks. This is much easier than editing a full template in tools like Canva.
For example, in Canva, you can only change the background of the entire infographic. But in Visme, each block (or each part) of the infographic can have its own background as a photo or a color.
The free package from Visme, gives you access to 5 projects, but has limited templates and you can only download your infographic as a JPG file. To download as PDF and to have access to premium templates, you will have to register a standard package for $ 14 / month.
If you want to create a simple text-based and graphic infographic, Canva is the best choice. If your infographic is heavy on charts and has many custom sections, use Visme. And if you want to focus more on aesthetics, Picktogram's beautiful templates will work.
Wish you find the right tool!
Good luck!
Was this article helpful?
Your feedback helps us improve.
Related Articles
 5 Best Free Tools to Create Infographics5 minutes read
 How to create professional Infographic by Piktochart5 minutes read
 Want to create a perfect infographic, please refer to this advice from experts4 minutes read
 Top 10 websites to create beautiful infographics4 minutes read
 5 Infographics tricks for beginners to Marketing6 minutes read
 Guide to creating infographics on Manus3 minutes read
Reader Comments 0
Sign in with email or Google to join the discussion.