Table of Contents
This guide provides a clear, practical overview of steps to create an infographic on canva, with useful context, important details, and straightforward takeaways for everyday readers.
Here's a step-by-step guide on how to create an infographic on Canva.
1. Register or log in to Canva
To create an infographic, you first need to sign up or log in to Canva. You can sign up with your email, Facebook or Google account.
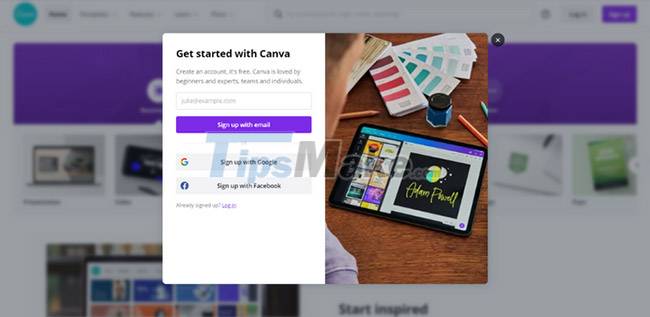
2. Create canvas
Once you're signed in, click Create a Design in the top right corner of the home page. Then type "infographic" in the search bar that appears in the menu.
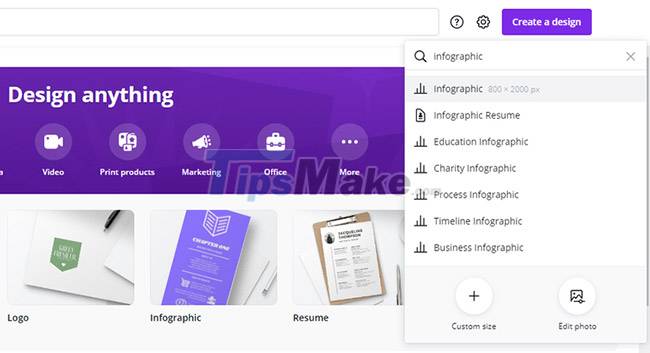
Select the infographic option from the search results and Canva will pull up an 800 x 2000 pixel blank canvas by default. While you'll be using a pre-made template, you can create your infographic from scratch if you'd like.
3. Browse infographic templates
After opening the dashboard, you'll see a bunch of infographic templates on the left side of the screen. They differ in themes, styles, colors, etc.

You can enter keywords in the search bar to quickly find a specific type of template you want to use. Or, scroll down to find a template that matches your message, then click on it to make it editable.
When you start editing your template, you can quickly add a chart to represent your data (discussed later).
4. Customize the background
You can keep the background of the pre-made template or adjust it according to your needs. To change the background, go to the left sidebar menu and click Background. Then, choose a color or template that matches your brand or personal style.
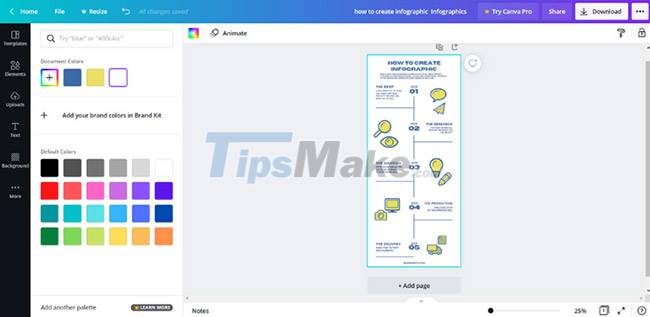
After selecting the background, adjust its appearance from the editor menu just above the page. You can also change its color, add filters, adjust transparency, etc., from the same menu.
5. Change the text
To replace the demo text with your own information, click the demo text and press Delete to delete it. Then write directly in the currently empty text box.
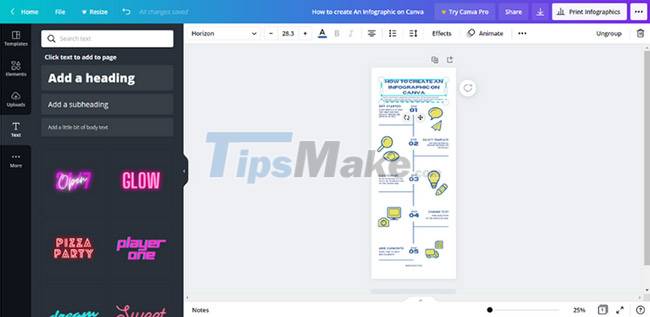
To modify the font, select the text you want to edit, then choose font types, sizes, and colors from the text toolbar at the top of the screen.
Alternatively, click the Text option on the left side of the screen, and drag and drop the decorative font you want into the infographic. You can then resize and edit to your liking.
6. Add Graphic Elements
Canva categorizes graphic elements into lines and shapes, graphics, photos, videos, grids, frames, and charts. To use an element, click on a category and then drag and drop the element you want to add to the infographic.
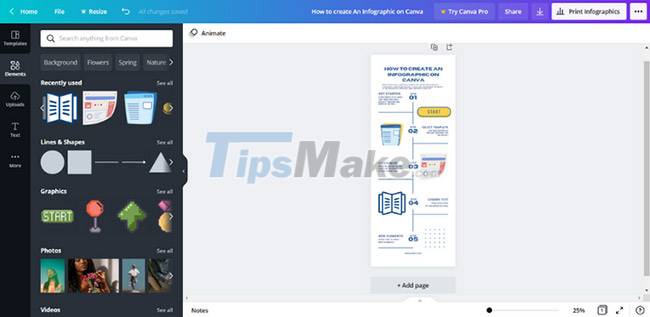
If you are looking for a specific image, use the search function to filter the results. Canva allows you to upload and add your own original graphics or photos. You can also resize uploads and move them around the template.
Remember that some elements are not free to use. Paid elements will have a crown icon in the bottom right corner.
How to add a chart to your infographic
Sometimes you will need a chart to represent your data. Here's how to add a chart to your infographic:
Step 1: After opening an infographic template, click the More tab in the left sidebar and select Charts. Several charts will be displayed for you to choose from.
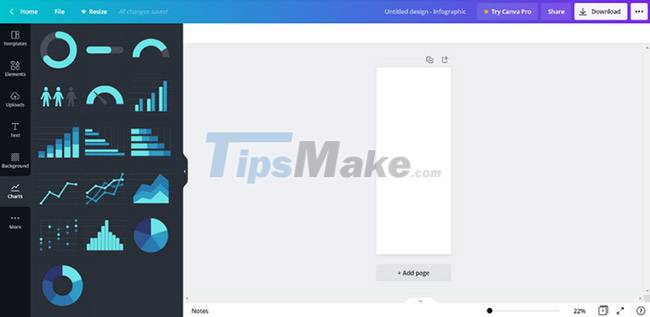
Step 2: Select a chart. For this tutorial, the article will use a pie chart.
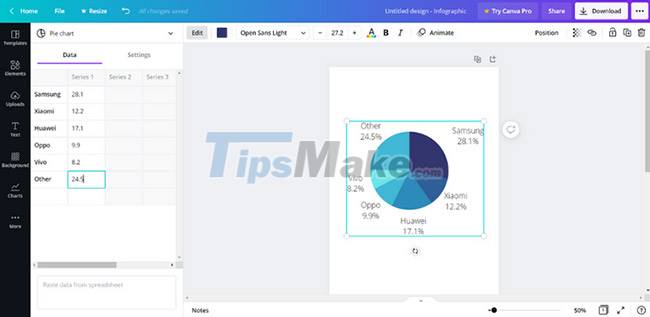
Step 3: To edit the chart, click the Edit tab above the page. A table with labels and numbers will appear in the left sidebar.

Step 4: Click on the fields in the table to enter your data. To add more rows, click the bottom row of the table.
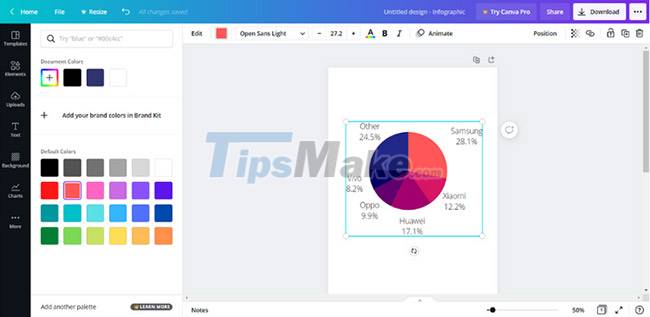
Step 5: To change the color of the chart, click the color box in the toolbar at the top of the screen. Then select the color you want to change the color scheme of the chart.
7. Save and share your infographic
Once you've customized the infographic to your liking, click the three-dot menu at the top right to bring up the Share option . Share the infographic directly to social media platforms or embed it on your website.
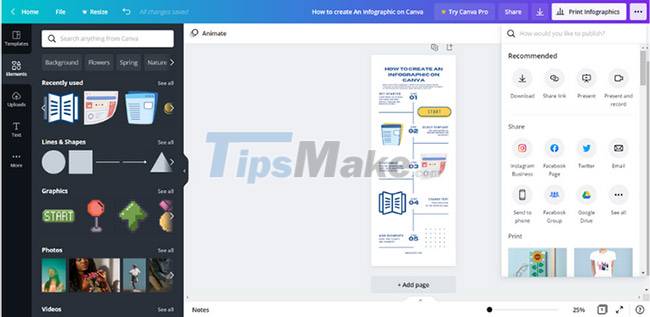
Click the Download icon next to Print Infographics to save it as a PNG, JPG, or PDF file.
In addition to Canva, there are many other tools to help create infographics. Reference: 11 free tools to help make infographic creation simpler to find the right choice for you!
Hope you are succesful.
Key Takeaways
Use the information above as a practical reference for steps to create an infographic on canva. Review each step carefully, confirm any requirements, and choose the option that best fits your situation.
FAQ
What does this guide explain about Steps to Create an Infographic on Canva?
It explains the main concepts, practical considerations, and useful steps related to steps to create an infographic on canva without requiring advanced knowledge.
Who can benefit from learning about Steps to Create an Infographic on Canva?
This information is useful for readers who want a clear overview, practical guidance, and reliable steps related to steps to create an infographic on canva.
What should I check before applying this information?
Review the requirements, confirm that your device, software, or situation matches the instructions, and back up important data before making major changes.
Related Articles
 Design Infographics in Canva AI from Data4 minutes read
 Instructions for Creating Stickers on Canva3 minutes read
 Guide to Designing Posters in Canva AI4 minutes read
 11 Free Tools That Support Creating Simple Infographic13 minutes read
 Instructions for Creating QR Codes on Canva3 minutes read
 Want to Create a Perfect Infographic, Please Refer to This Advice4 minutes read
Reader Comments 0
Sign in with email or Google to join the discussion.