
JavaScript code to create bubble chart with custom marker
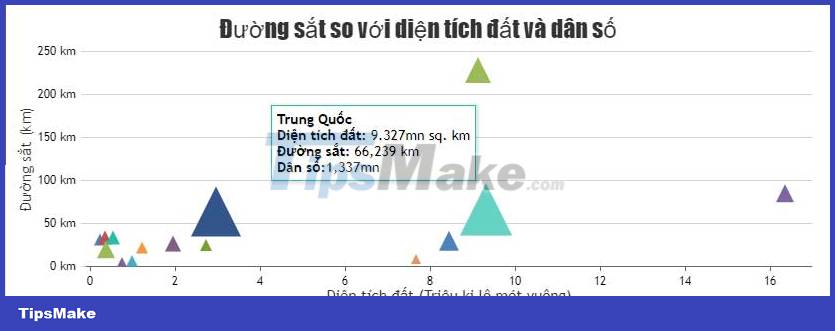
You can present the bubble chart using the default format or any other type of markup such as triangles, squares, etc. This feature can be useful in case the bubble is no longer suitable for illustrating the elements. data point.
The example below shows a bubble chart with a customized markup style and JavaScript source code that you can edit in your browser or save to your device to run locally .
Source : CanvasJS
Tweak the chart
Like other bubble charts, you can change the properties to get the results you want. For example:
markerType: Change bookmark stylemarkerSize: Resize markermarkerColor: Selection of marker colormarkerBorderThickness: Mark border thicknessmarkerBorderColor: Marker border color
Update 27 June 2023
You should read it
- JavaScript code to create OHLC and line chart combo chart template
- JavaScript code to create box & whisker chart/graph templates with custom colors
- Code of chart/bar graph with error combination
- JavaScript code to generate dynamic line graphs/charts
- JavaScript code to generate error charts & graphs
- JavaScript code that generates box and whisker charts containing outliers
- JavaScript code to generate box and whisker charts/graphs
- JavaScript code to generate error line graph/graph
- JavaScript code to create Pareto charts & graphs
- JavaScript code to create dynamic charts/graphs
- JavaScript code that generates Pareto chart template with Index/Data . label
- JavaScript code to create multi-series graphs that update live data
Maybe you are interested
What is the round hole on a safety pin used for? 6 simple tips to help your Samsung phone last for years Samsung accounts that have not been used for 24 months will be deleted: This is your last chance to save your important information! How to check VRAM capacity on Windows 11 Latest Code Football Arena King of Football Gamota How to use your phone's Focus Mode to focus more on what you're doing