Charts are tools that make reporting your data intuitive, based on which specific assessments and directions can be developed. The following article will guide you in detail how to create charts in Word 2016.
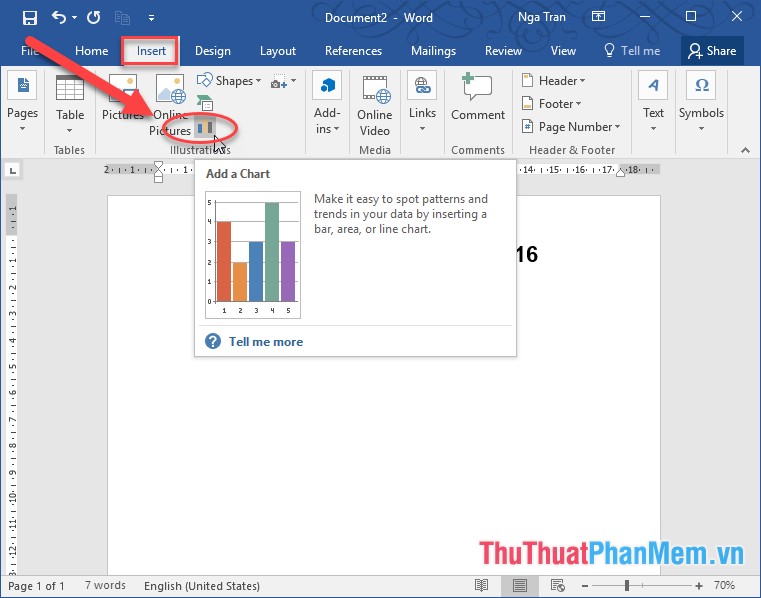
Step 1: Go to the Insert tab -> Chart:

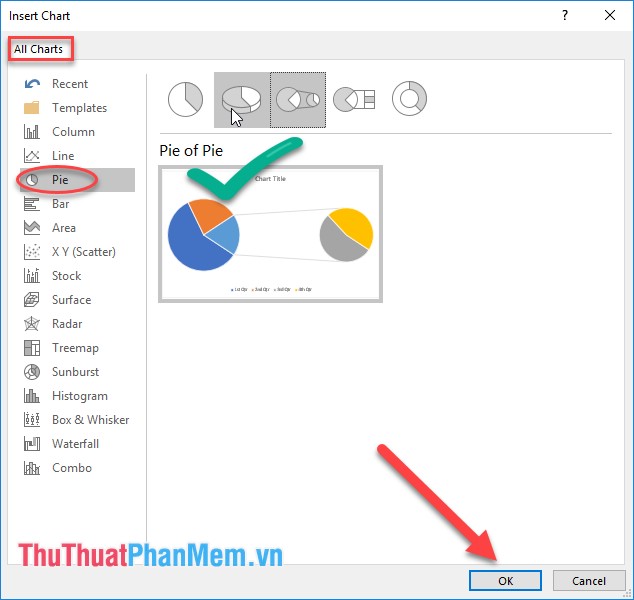
Step 2: The Insert Chart dialog box appears, select the chart type -> click OK:

Step 3: The chart type is inserted with the default value, the remaining you enter data in Excel file to draw the chart:
Step 4: Edit the title for the chart by right-clicking the title -> select Edit Text:
Results of editing the title for the chart:
Step 5: Edit the note for the chart by double-clicking the note line at the bottom of the chart -> Format Legend window appears to change the font style, font, color and position of the note on the chart:
So basically you've drawn the chart:
In addition, after drawing the chart you want to change the chart type, click the chart -> Design -> click Change Chart Type:
Select the type of chart you want to change -> click OK:
As a result, you have changed the chart style:
To edit the style, font, font color . click the chart -> select the Format tab to change the font format on the chart:
Edit the chart style, color . click the chart -> go to the Design tab -> change options:
Above are instructions on how to draw charts in Word 2016. I wish you success!
