Create and insert Word 2016 charts
Charts are tools you can use to convey information in graphical form. Using the chart in the document will help you illustrate numerical data such as comparisons or trends for readers to understand better. Let's learn how to create and edit charts in Word 2016 below!
Table of Contents
Charts are tools you can use to convey information in graphical form. Using the chart in the document will help you illustrate numerical data such as comparisons or trends for readers to understand better.
There are many types of charts to choose from, such as line charts, pie charts, column charts, etc. You can use them depending on the purpose and content accordingly.
How to insert a Word 2016 chart
Word 2016 uses a separate spreadsheet window to import and edit chart data, similar to Excel. The data entry process is also quite simple.
Insert chart
Step 1: Place the insertion point where you want the chart to appear.
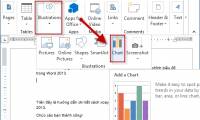
Step 2: Navigate to the Insert tab, then click Chart in Illustrations.

Step 3: A dialog box will appear. To see options, click on the chart type from the left pane, then browse to the charts on the right side of the window.
Step 4: Select the chart type you want, then click OK.

Step 5: At this time, the chart and spreadsheet will appear. Text in spreadsheets is only in the form of a template and you need to replace them with your source data.
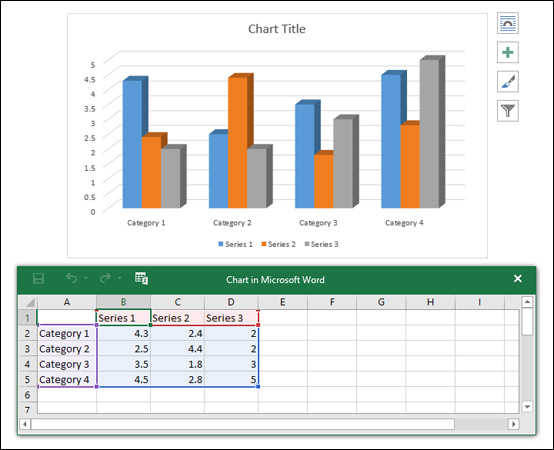
Step 6: Enter the source data into the spreadsheet.
Step 7: By default, only the attached data in the blue box appears in the chart. Therefore, if you want to increase or decrease the range of data that appears, click and drag the lower right corner of the blue box.

Step 8: When you have finished entering data, click on the X to close the spreadsheet window.
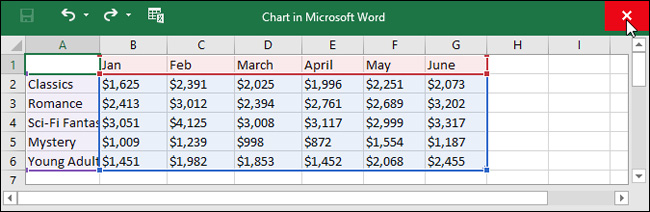
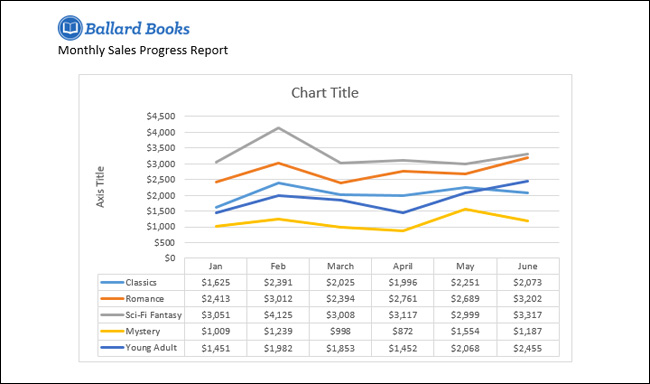
Chart results obtained.

Note: To edit the chart again, simply click on the chart, then click Edit Data in the Design tab. The spreadsheet window will appear for you to change.
Create a chart with available Excel data
If you already have data in an Excel file, you can copy and paste it into Word instead of having to re-enter it manually. Just open the spreadsheet in Excel, copy and paste into Word as normal source data.
Edit Word 2016 charts with dedicated tools
Convert row and column data
Sometimes you will want to change the chart by data group. Example: In the chart below, data is grouped by category and each column is 1 month. If we convert rows and columns, the data will be grouped by month. In both cases, the data is the same, only the presentation is different.
Step 1: Select the chart you want to edit. The Design tab will appear on the right side of the ribbon bar
Step 2: From the Design tab, click Edit Data in the Data section.
Step 3: Click on the chart again, then do the same step 2 and select Switch Row / Column.
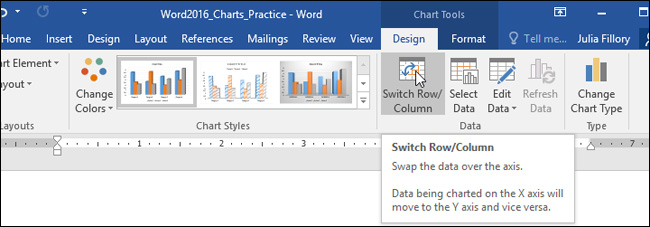
Step 4: The rows and columns will be converted for each other. In our example, data has been grouped by month and each column represents categories.
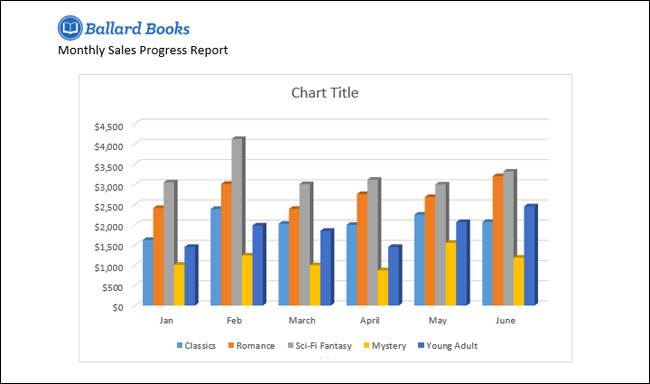
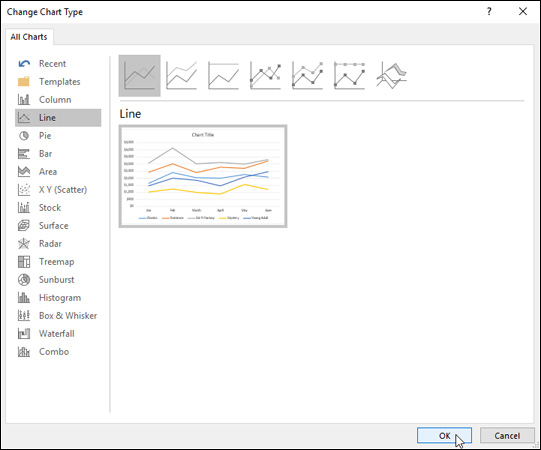
Change chart type
Step 1: Select the chart you want to change. From the Design tab, click Change Chart Type.
Step 2: A dialog box will appear. Here, you can select the appropriate chart type and click OK.
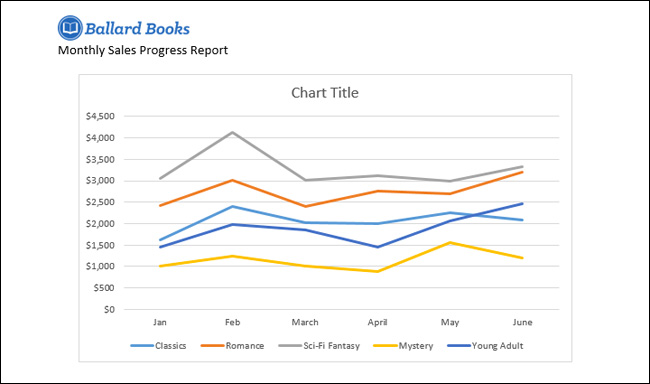
Step 3: Results after changing chart type. In our example, the line chart will make it easier for readers to understand.
Change chart layout
Step 1: Select the chart you want to edit. From the Design tab, click Quick Layout, then select the chart layout in the drop-down menu.
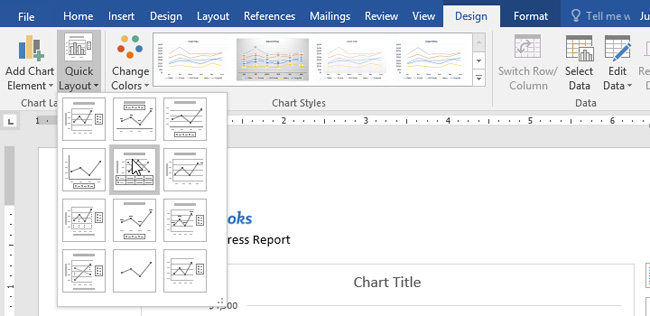
Step 2: The chart will update to display the new layout.
Note: If you see the chart not displaying the content you want, you can select Add Chart Element on the Design tab to add the necessary criteria.
Change the chart type
Step 1: Select the chart you want to edit. In the Design tab, click the drop-down arrow in Chart Styles and select the chart style you want.

The result will be as shown below.

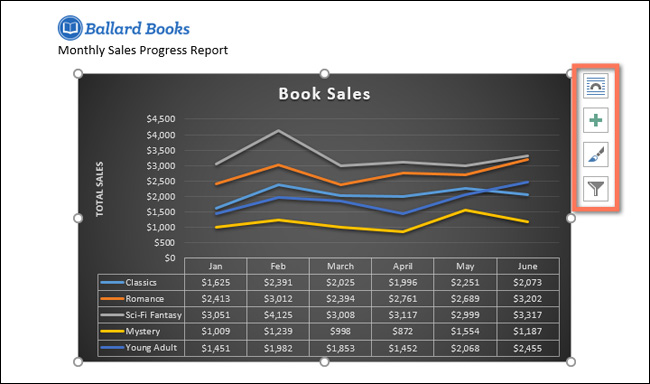
For faster customization, you can use formatting shortcuts on the right side of the chart.
Good luck!
You can see more:
- Word 2016 Complete Guide (Part 21): How to insert and create tables
- Complete Word 2016 tutorial (Part 20): Align, align, and group objects
Was this article helpful?
Your feedback helps us improve.
Related Articles
 Instructions for inserting, drawing and creating charts in Word 20073 minutes read
 The most detailed instructions on drawing, creating, and inserting charts in Word 20134 minutes read
 Insert and edit charts in Word2 minutes read
 Insert and edit charts in Excel2 minutes read
 MS PowerPoint 2007 - Lesson 7: Insert images and graphics in the slide3 minutes read
 Work with charts in PowerPoint 20167 minutes read
Reader Comments 0
Sign in with email or Google to join the discussion.