How to create a pie chart in Word
You are trying to create a pie chart in Word, but you do not know how to create a pie chart in Word? So please refer to how to draw a pie chart in Word that the article shares below.
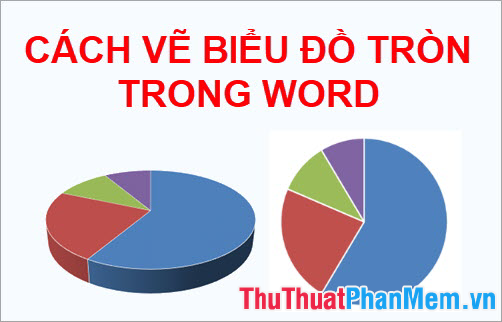
Here TipsMake.vn share to you how to draw pie charts in Word, please follow along.
Data for pie charts
Pie charts can convert a column or row of spreadsheet data into a pie chart. Note about the data to plot a pie chart:
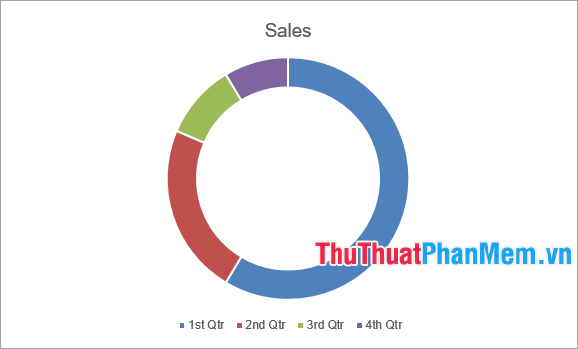
- Draw a pie chart when there is only one data series, if more than one string, you select the Donut chart .
- The values in the data must not be either 0 or null, or a negative value.
- There shouldn't be too many data types, because if too many, there will be more slices in the pie chart that will be harder to read.
Types of pie charts
-
2D pie chart
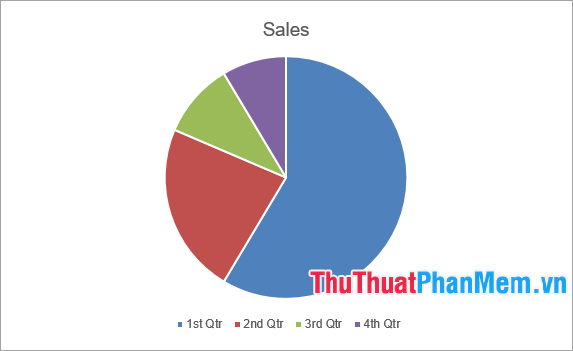
2D pie chart includes chart Pie conventional chart Pie of Pie and Bar of Pie . The usual 2D Pie chart is as follows:
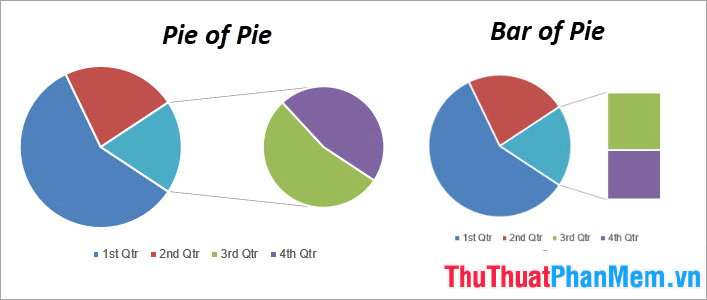
Pie chart of pie chart ( Pie of Pie ) and bar chart of pie chart ( Bar of Pie ). Use these two types of pie charts when you have many small sections, which will be displayed further outside the main pie chart. You need to arrange the data properly because the last three data in the data table will appear in the sub chart.
-
3-D Pie chart
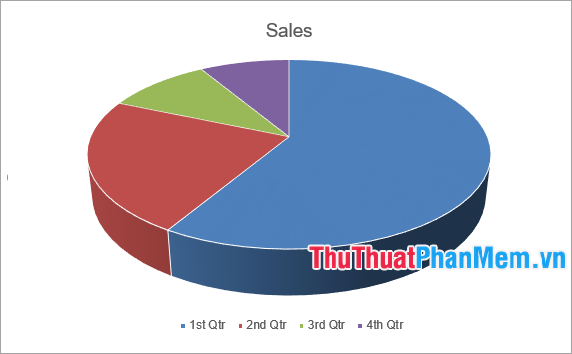
Chart 3D Pie is a pie chart in 3D (three-dimensional block), if you want to draw a 3D pie chart, then you select this chart type.
-
Donut chart
The Dougnnut pie chart is like a donut pie , you can use the donut chart to draw the pie chart. This chart can be drawn when you have 1 or more types of data.
How to create a pie chart in Word
Step 1 : In Word, select the tab Insert -> Chart.

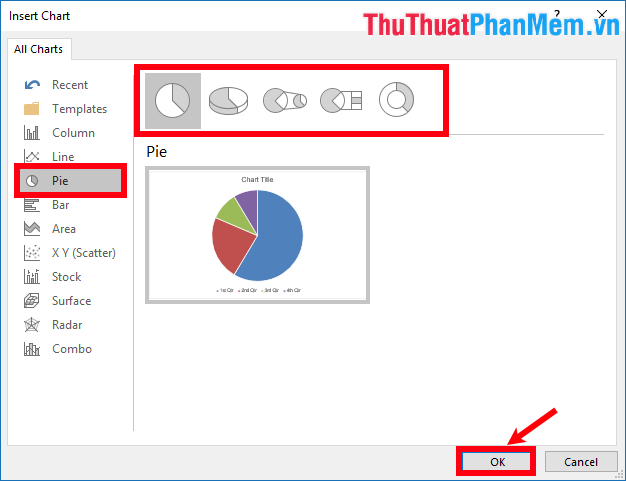
Step 2: The Insert Chart dialog box appears , select Pie and select the type of chart you want to draw.
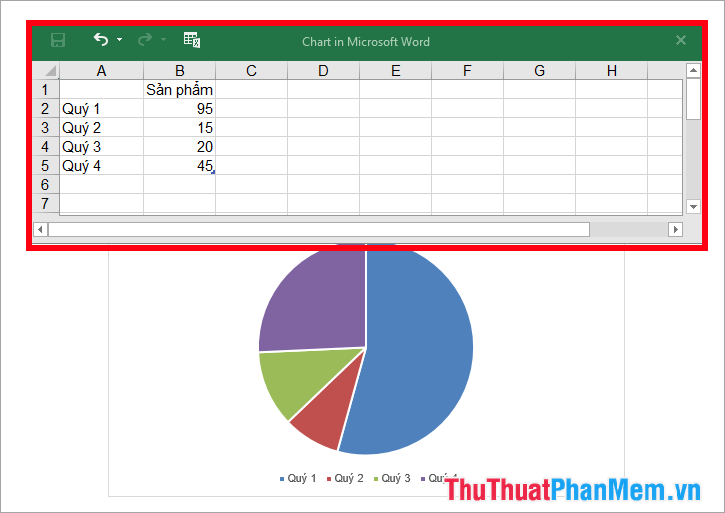
Step 3: The pie chart is added to Word along with a spreadsheet that appears in Word, enter the data you want to draw the pie chart instead of the sample data.
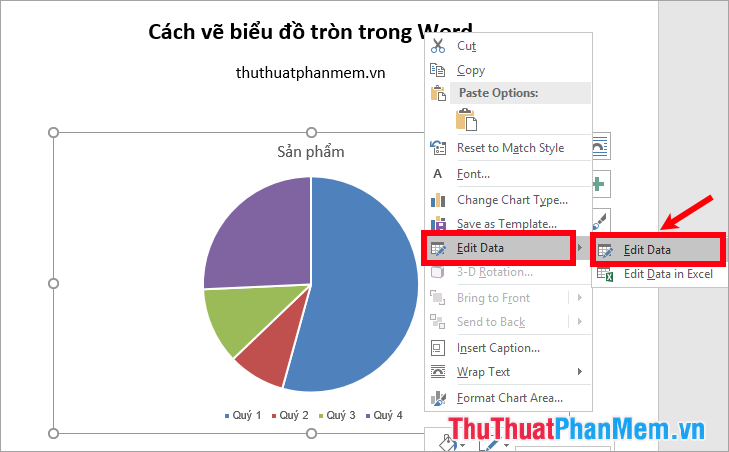
After entering the data, you turn off the worksheet, to open the workbook again to change the data as needed, right-click the chart and select Edit Data -> Edit Data.
Step 4: Edit the chart
1. Edit the title of the chart
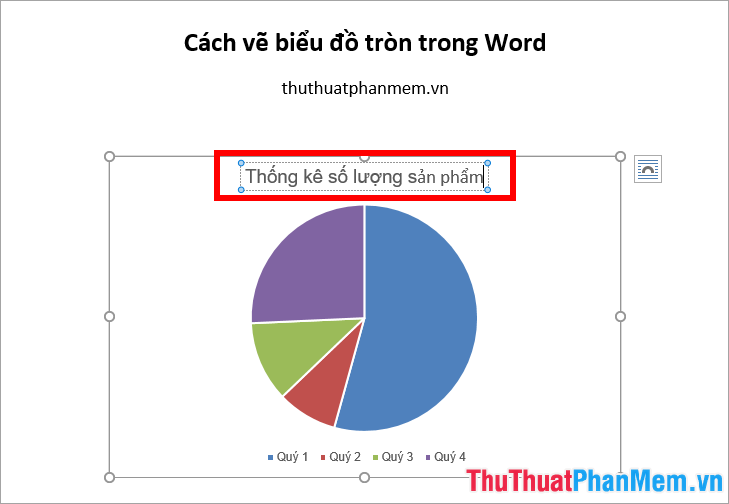
If on the chart already title, to edit the title you just need to click on the title and enter a title for the chart.
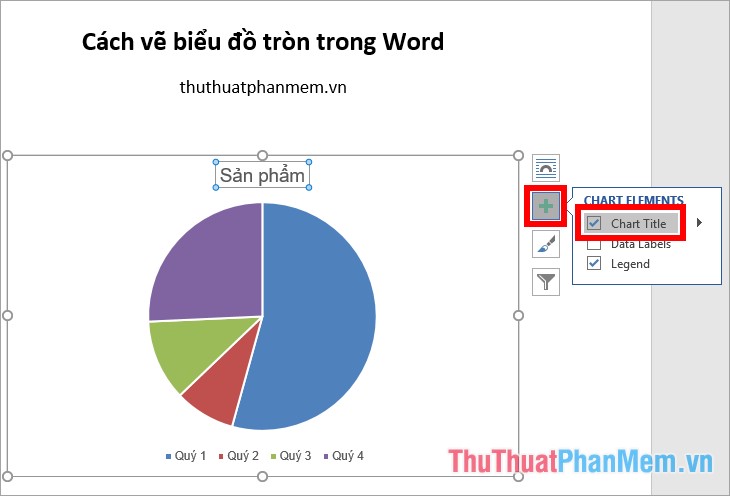
If the chart does not display the title, click on the chart and select the Chart Plus icon in the green, then tick the Chart Title box to display the chart title.
2. Move and resize the chart
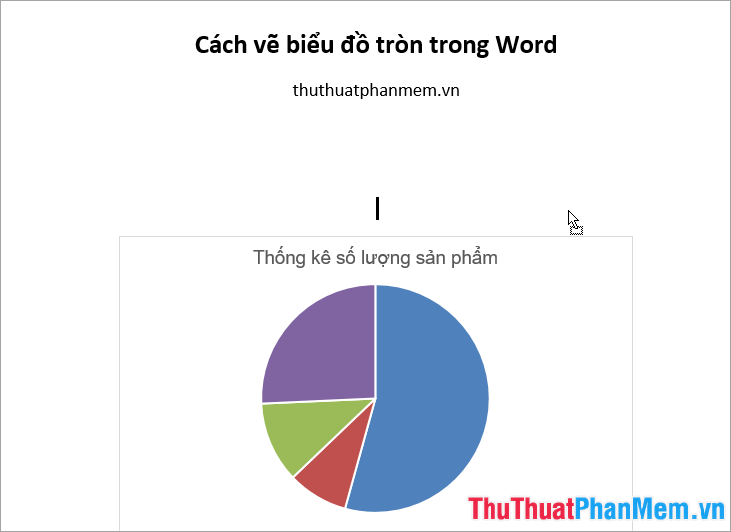
You can use the alignment of Word to position the chart or hold down the left mouse button and drag the chart to the position you want.
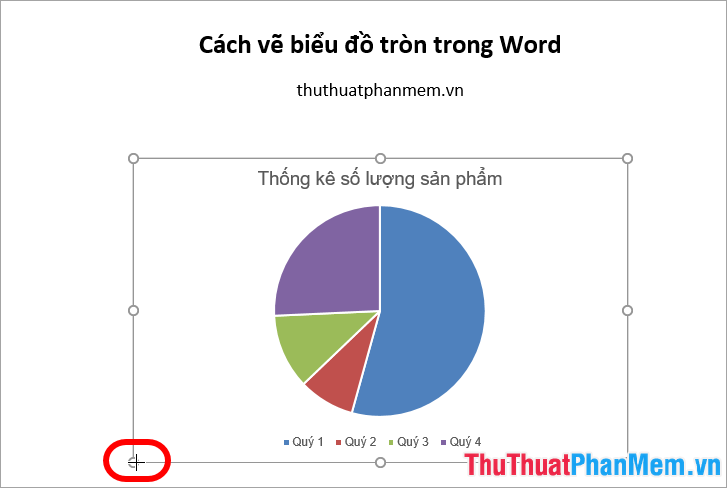
To change the size of the chart you select the chart, there are 8 knobs around the border of the chart, you move the mouse pointer on one of the 8 knobs that appear a two-way arrow. and custom size arbitrary.
3. Add data sticker to chart
Select the chart, next you click the Chart Elements icon , tick the Data Labels check box to add data sticker.
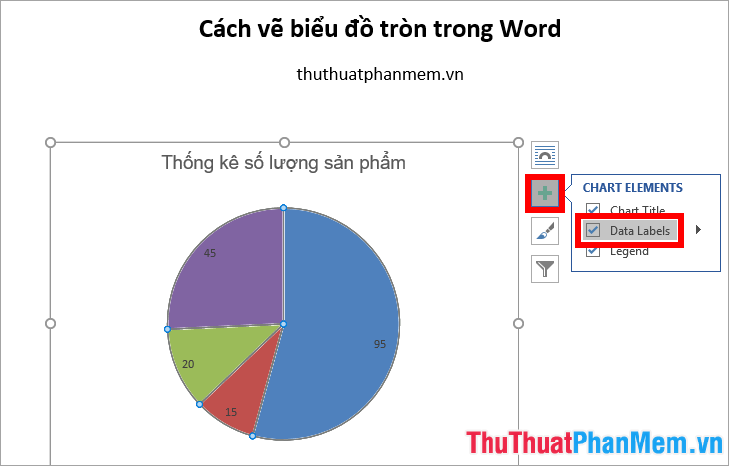
To change the position showing the data sticker, select the triangle icon next to Data Labels and choose the location you want to display the sticker.
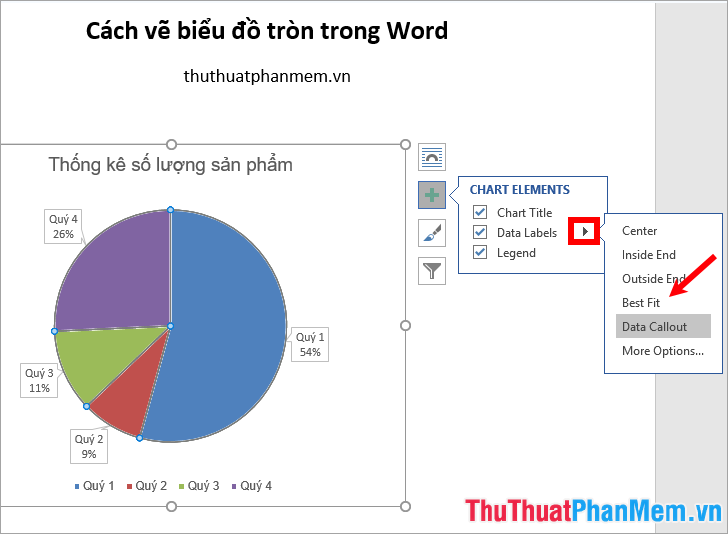
4. Add notes to the chart
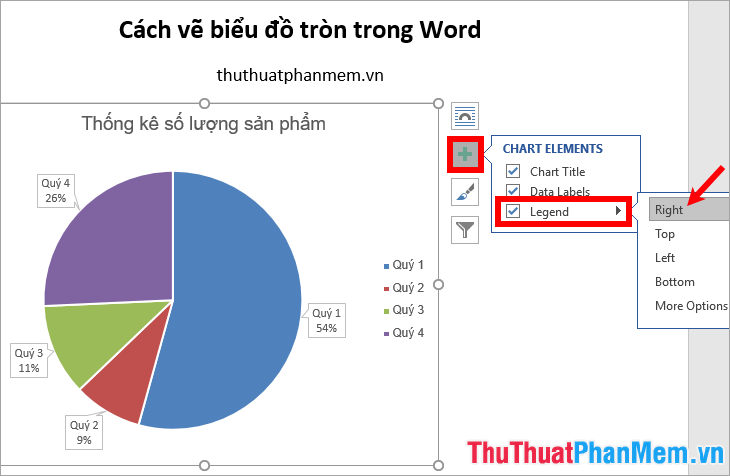
Similar to adding data sticker, select the plus icon and tick Legend before tick to add a legend to the chart. Click the black triangle icon and choose a location to display the comment.
5. Change the style and color for the chart
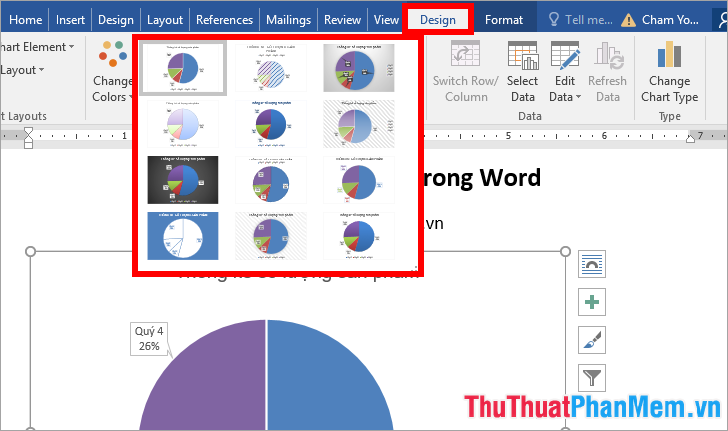
You choose the icon of the brush ( Chart Styles), next you select the chart style you want in the Style section .
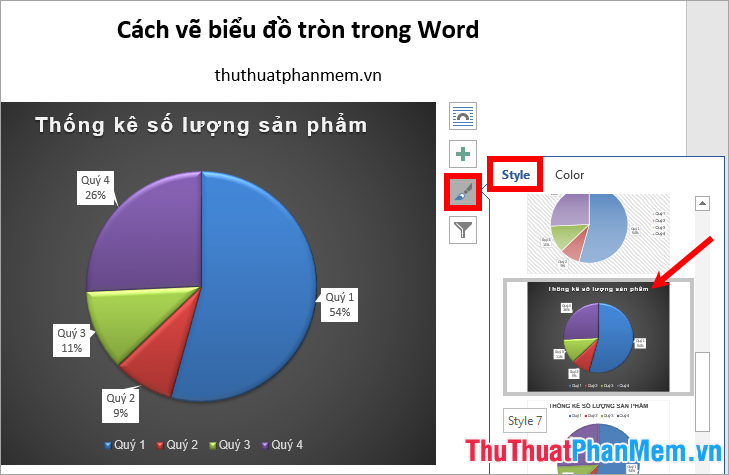
Or you can choose the chart, select the Design tab and select the chart style in the Chart Styles section .
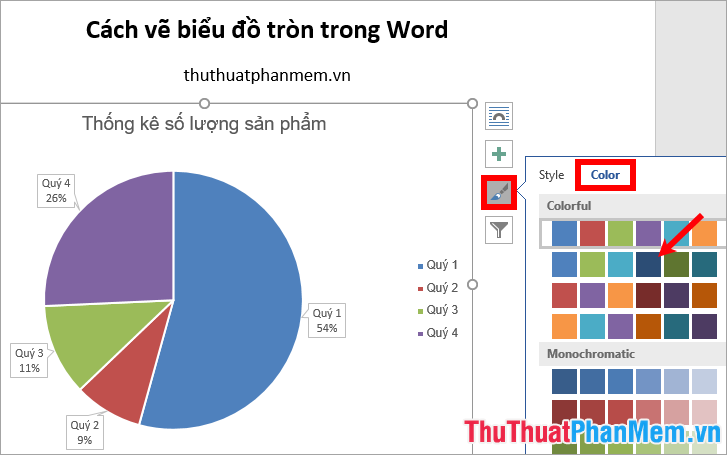
To change the color for the chart, select Chart Style -> choose the color in the Color section.
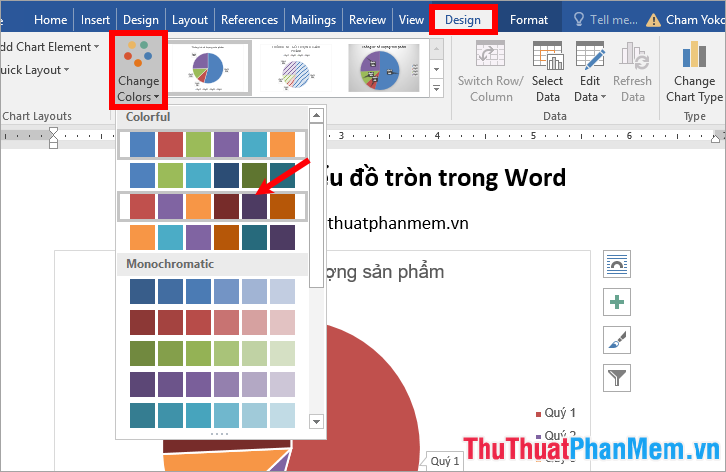
Or you can change the color of the chart by selecting the chart -> Design -> Change Colors -> choosing colors.
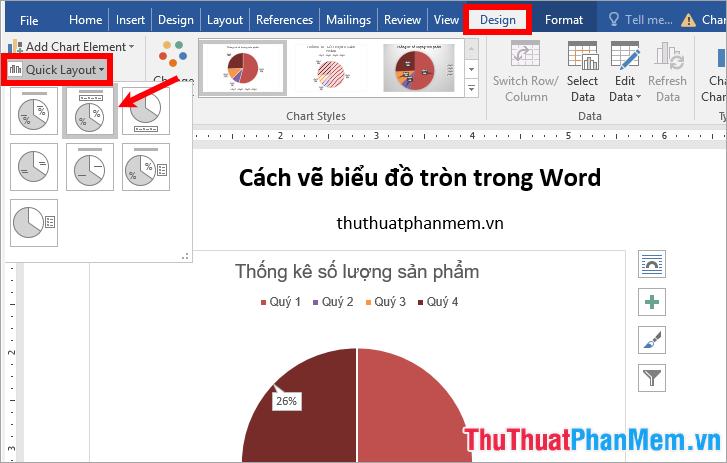
6. Quickly change the layout for charts
If you want to change the layout of the chart (the position and display of the elements on the chart) select the chart -> Design -> Quick Layout -> select the layout you want.
7. Separate one or more slices from the chart
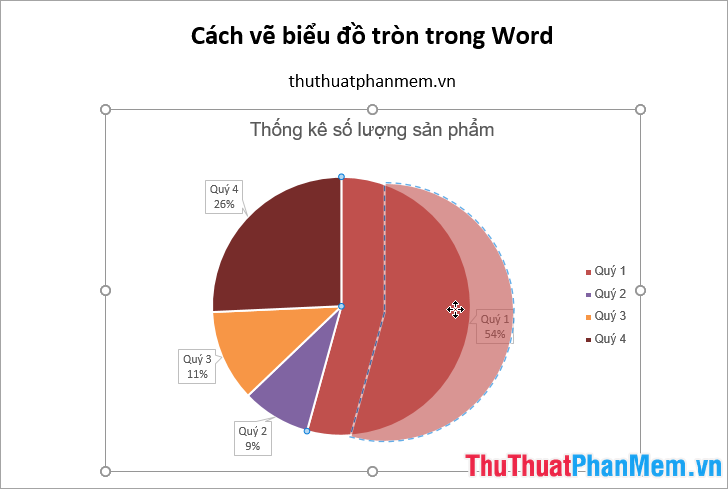
To separate a slice from the chart, select the slice to be separated and hold down the left mouse button to drag it to the position you want.
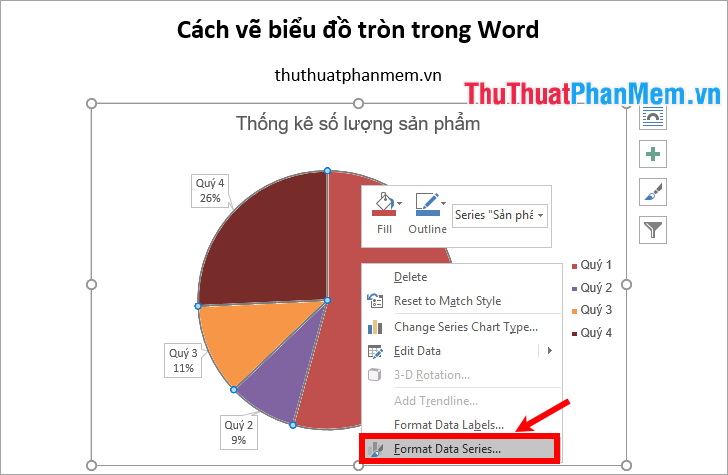
To separate all slices of a pie chart, right-click the pie chart, and select Format Data Series.
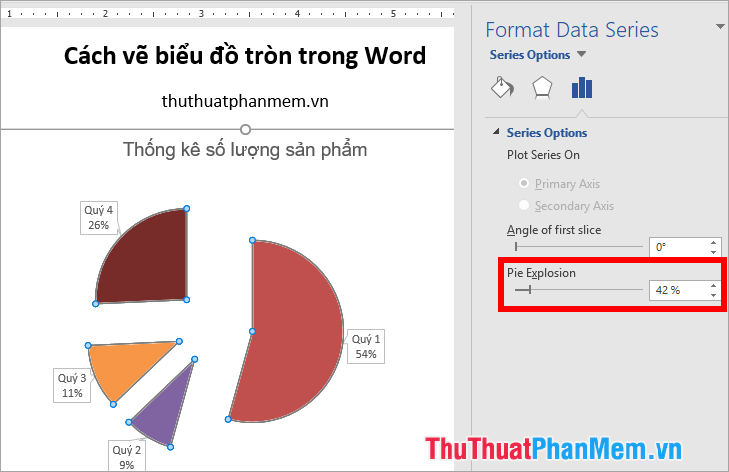
In the Format Data Series section on the right, drag the horizontal slider in Pie Explosion to separate all slices of the pie chart.
8. Rotate the pie chart
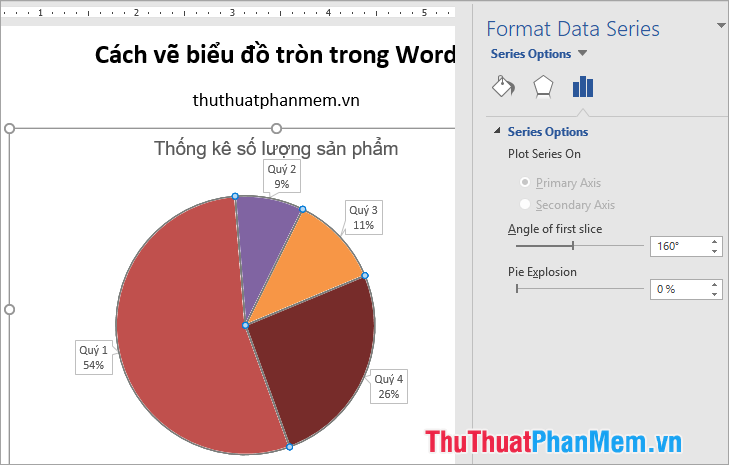
You open Format Data Series by right-clicking on the chart and selecting Format Data Series . In Series Options, drag the slider in the Angle of first slice to rotate the chart.
Above TipsMake.vn shared with you how to draw pie charts in Word, and how to edit the pie chart to suit your purposes. Hopefully, through this article, you will easily draw pie charts in Word. Good luck!