Article on the subject of "graph"
-

Detailed instructions on how to graph in excel
the article will help you learn how to graph in excel and help you manage the data you have.
-
How to Import, Graph, and Label Excel Data in MATLAB
whether you are an experienced matlab user or a novice, you may not be fully aware of matlab's graphing abilities. matlab allows you to easily customize, label, and analyze graphs, giving you more freedom than the traditional excel graph....
-
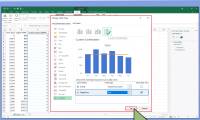
How to Make a Bar Graph in Excel
this wikihow teaches you how to make a visual representation of your data in microsoft excel using a bar graph. open microsoft excel. it resembles a white 'x' on a green background.
-
How to Make a Line Graph in Microsoft Excel
this wikihow teaches you how to create a line graph from microsoft excel data. you can do this on both windows and mac versions of excel. open microsoft excel. double-click the excel program icon, which resembles a white 'x' on a green...
-
How to Add a Graph to Microsoft Word
this wikihow teaches you how to add a data chart to your microsoft word document. open a microsoft word document. to do so, you can double-click an existing word document, or you can open microsoft word and select your document from the...
-
Coreldraw - Lesson 7: Charting tool
the graph paper tool is used to create hundreds of rectangles, which are grouped together as a technical drawing paper. this tool is very suitable for charting, drawing techniques need precision.
-
Graph data structure (Graph)
a graph (graph) is a form of visual representation of a set of objects in which pairs of objects are connected by links. interconnected objects are represented by points called vertices, and links that connect vertices are called edges.
-
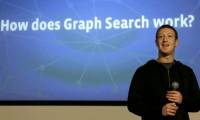
Instructions for searching with Facebook Graph Search
graph search is an old-style search engine on facebook, which allows users to search for friends, pictures, landmarks, ... according to the most complex conditions that users offer.
-
Facebook gradually improves Graph Search
facebook said its search system is capable of processing an average of 1 billion searches a day and developers are still actively working to improve the tool.
-
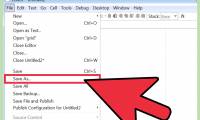
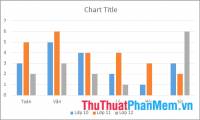
Instructions on how to graph in Excel
instructions on how to graph in excel. excel helps you to process and calculate data effectively, excel supports you to graph quickly.
-
Detailed instructions on how to graph in excel
the article will help you learn how to graph in excel and help you manage the data you have.
-
How to Add a Second Y Axis to a Graph in Microsoft Excel
it can be very helpful to put multiple data trends onto one graph in excel. but, if your data has different units, you may feel like you can't create the graph you need. but have no fear, you can -- and it is actually pretty easy! this...
-
How to Import, Graph, and Label Excel Data in MATLAB
whether you are an experienced matlab user or a novice, you may not be fully aware of matlab's graphing abilities. matlab allows you to easily customize, label, and analyze graphs, giving you more freedom than the traditional excel graph....
-
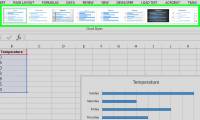
How to Make a Bar Graph in Excel
this wikihow teaches you how to make a visual representation of your data in microsoft excel using a bar graph. open microsoft excel. it resembles a white 'x' on a green background.
-
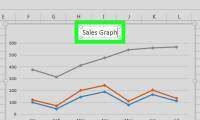
How to Make a Line Graph in Microsoft Excel
this wikihow teaches you how to create a line graph from microsoft excel data. you can do this on both windows and mac versions of excel. open microsoft excel. double-click the excel program icon, which resembles a white 'x' on a green...
-
Invite to see malware with visual images with VirusTotal Graph
virustotal has just released a new feature - graph - which allows users to visualize data from available files.
-
Search algorithm by width
the breadth search algorithm (breadth first search - bfs for short) walks through a wide graph and uses a queue to memorize adjacent vertices to start the search when no peak is found. adjacent in any loop.
-
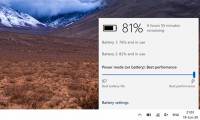
How to create a battery usage chart on Windows 10
windows 10 supports a small but quite useful feature that helps you know the status of your laptop battery continuously over time, which is to create a battery usage graph.
-
What is Windows Audio Device Graph Isolation and why is it running on a computer?
if you take the time to explore task manager, you may have seen the process called 'windows audio device graph isolation' and don't understand why it sometimes consumes system resources. this article will explain to you this process and how to fix it when it uses too many system resources.
-
How to implement a graph data structure in Golang
charts are one of the essential data structures that you must know as a programmer. let's learn how to create graph/graph data structures in golang !
-
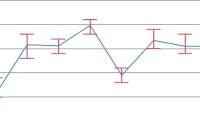
JavaScript code to generate error line graph/graph
the example below illustrates a sample error chart with line chart created with javascript. the article also provides source code for you to edit in the browser or save to your computer to run locally.
-
Deep search algorithm
deep search algorithms (depth first search - dfs for short), also called depth-first search algorithms, are algorithms that browse or search on a tree or graph and use the stack ( stack) to remember adjacent vertices to start the search when the adjacent vertex is not encountered in any loop.
-
How to Create a Probability Distribution Graph in Excel
tipsmake today will show you how to create a column histogram on microsoft excel. a probability distribution chart is a column graph that displays frequency data that allows you to calculate numbers.
-
Coreldraw - Lesson 7: Charting tool
the graph paper tool is used to create hundreds of rectangles, which are grouped together as a technical drawing paper. this tool is very suitable for charting, drawing techniques need precision.
-
How to graph functions in Excel
graph different excel functions when drawing graphs in excel.
-
How to graph trigonometric functions with Excel
want to graph a trigonometric function but don't know where to start? microsoft excel can help you. here's how to plot/graph a trigonometric function using excel.