How to Add a Graph to Microsoft Word
This wikiHow teaches you how to add a data chart to your Microsoft Word document. Open a Microsoft Word document. To do so, you can double-click an existing Word document, or you can open Microsoft Word and select your document from the...
Table of Contents
Part 1 of 2:
Inserting a Graph into Word
-
 Open a Microsoft Word document. To do so, you can double-click an existing Word document, or you can open Microsoft Word and select your document from the Recent section.
- If you're opening a new document, simply open the Microsoft Word program and click Blank document instead.
-
 Click in the document where you want to insert your graph. Doing so will place the blinking cursor where you clicked; this is where your graph will appear when you add it.
- For example, clicking below a paragraph of text will set that location as the place to insert your graph.
-
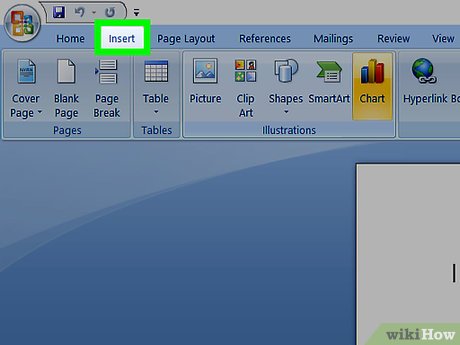 Click the Insert tab. It's at the top of the Word page, to the right of the Home tab.
 -
 Click Chart. You'll see this option below and to the right of the Insert tab. Its icon resembles several different-colored bars.
 -
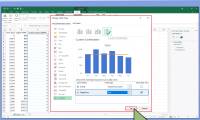
 Click a chart format. These are listed on the left side of the Chart pop-up window.
- A few common chart formats are Line, Column, and Pie.
- You can customize your chart's format by clicking an appearance option at the top of your format's window.
-
 Click OK. Doing so will insert your chart into your document.
- You'll also see a small Excel window with cells appear--this is where you'll input your data.
Part 2 of 2:
Adding Data to Your Graph
-
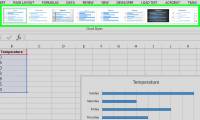
 Click a cell in the Excel window. Doing so will select it, which will allow you to add a point of data to that cell.
- The values in the "A" column dictate the X-axis data of your graph.
- The values in the "1" row each pertain to a different line or bar (e.g., "B1" is a line or bar, "C1" is a different line or bar, and so on).
- Numerical values outside of the "A" column or the "1" row represent different points of data on the Y-axis.
- Anything written in an Excel cell can be re-written to reflect your data.
-
 Type in a number or name.
 -
 Press ↵ Enter or ⏎ Return. Doing so will enter your data into the cell, allowing you to move on to another cell.
 -
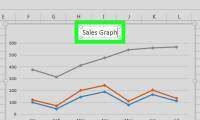
 Repeat this process for every point of data you need. As you enter data, your graph will change to display it.
 -
 Click X in the top right corner of the Excel window. Doing so will close the window and save your graph changes.
- You can re-open the Excel window at any time by clicking on your graph.
Was this article helpful?
Your feedback helps us improve.
Related Articles
 10 features in Word 2013 make working faster and easier12 minutes read
 How to Make a Bar Graph in Excel4 minutes read
 How to Make a Line Graph in Microsoft Excel4 minutes read
 Graph data structure (Graph)3 minutes read
 How to Add a Second Y Axis to a Graph in Microsoft Excel4 minutes read
 Instructions for searching with Facebook Graph Search5 minutes read
Reader Comments 0
Sign in with email or Google to join the discussion.