How to Read a Dump File (.dmp)
You can fix the cause of errors when reading memory dump files (memory errors). You can use the free utility 'BlueScreen
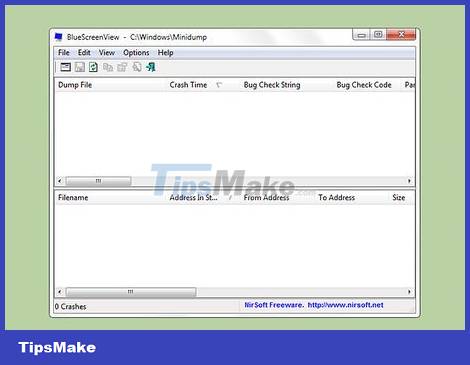
Use BlueScreenView

Use BlueScreenView if you just need to find out the cause of the error. Most users only need a dump file to determine what caused the application to stop working or not. blue screen problem. BlueScreenView is a free utility from NirSoft that analyzes dump files and determines which driver or factor is causing the error.
Files created when there are system errors are called "minidumps."

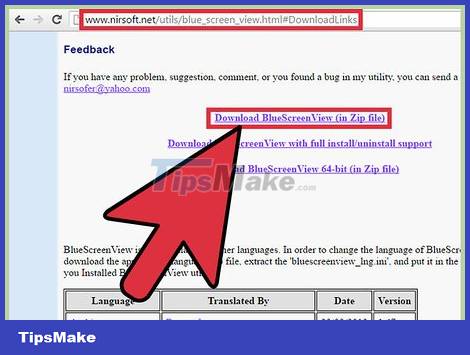
Download BlueScreenView. You can download BlueScreenView directly from NirSoft at nirsoft.net/utils/blue_screen_view.html.
You can download the program separately in ZIP format. You can launch the program without installation. After downloading the ZIP file, right-click and select "Extract" (Unzip) to create a new folder containing the BlueScreenView program.
Start BlueScreenView. After extracting BlueScreenView from the ZIP file, launch the program in the folder. You are asked by Windows to continue.
Find the dump file you want to analyze. When a computer error occurs, the file "minidump" will be created in the Windows folder. These files have a .dmp extension, which BlueScreenView can read and analyze the situation for you. You can find the Minidump file at C:WindowsMinidump. If you don't see the file, you need to adjust it to show hidden files:
On Windows 10 and 8, click on the "View" (Display) in Windows Explorer and check the "Hidden items" (hidden category).
On Windows 7 and earlier, open Folder Options in Control Panel, click the "View" tab, then select "Show hidden files, folders, and drives" (Show hidden files, folders and drives).
Drag the .dmp file into the BlueScreenView window. The fastest way to open a .dmp file is to drag it into the window. The file is not moved from its original location. The lower part of the BlueScreenView window will display data after dragging the file into the program window.
Find column "Caused By Driver" (Driver Cause) in the first section. You may have to scroll down to find this column. This column displays the driver that caused the system error.
You can find the problem driver highlighted in red in the lower part of the window. Double click on the highlighted category to see details: product name, description, link.
Use this information to fix the problem. Now that you know which driver is causing the problem, you can proceed with the fix. Please search online using the keyword "driver name having problem" to refer to the experiences of people who have encountered the same problem as you.
Use WinDBG
Use this method for deeper analysis. Most people do not need to use Windows Debugger to open the MEMORY.DMP file to identify corrupted code in the memory. Remember when encountering system errors. If you want to learn how Windows uses drivers and memory, or want to analyze dump files for development, Windows Debugger can provide you with a lot of information.
Download the Windows Software Development Kit (WDK). This program includes WinDBG - which you use to open the dump file. You can download the WDK installer here.
Run file sdksetup.exe. This starts the installer. Skip the first few screens and keep the default settings.
Uncheck everything except "Debugging Tools for Windows." You can uncheck all other functions you don't need set when opening the dump file. This can save installation time and disk space.
Wait for the file to download and install. This process may take a few minutes.
Open Command Prompt as administrator. You need to open Command Prompt to associate the .dmp file with WinDBG, so the program can analyze the file. You start Command Prompt in the "system32". folder
Windows 10 and 8 - Right-click the Windows button and select "Command Prompt (Admin)."
Windows 7 - Open the Start menu and type cmd. Press the key Ctrl+⇧ Shift+↵ Enter.
Navigate to the debugger folder. Enter the command below to switch to the correct folder. If you're using Windows 10, you can copy and paste the command. For older versions, you have to type: yourself
cdProgram Files (x86)Windows Kits8.1Debuggersx64
Enter the command to link to the dump file. Enter the following command to link WinDBG to the .dmp file. Windows 10 users can copy and paste the following command:
windbg.exe -IA
If you enter the command correctly, a blank WinDBG window will appear, which you can close.
Start WinDBG. You need to configure WinDBG to download the correct file from Microsoft to open the .dmp file. You must do this when opening the WinDBG program.
The fastest way to start the program is to press the ⊞ Win key and type "windbg."
Click on "File" (File) and select "Symbol File Path" (Symbol file path). Operation This will open a new window.
Copy and paste the following address. This will tell WinDBG to download the necessary symbols from Microsoft, and store them at C:SymCache:
SRV*C:SymCache*http://msdl.microsoft.com/download/symbols
FolderC:SymCachewill grow larger each time you open the debug file and download additional symbols from Microsoft.
Find the dump file you want to analyze. The file (.dmp) is created when there is a system error. By default, you can find them in the folderC:WindowsMinidumpafter system restore. Files can also be in directoriesC:WindowsMEMORY.DMP. If you can't find the file, you need to adjust it to show hidden files:
On Windows 10 and 8, click on the "View" in Windows Explorer and uncheck the "Hidden items" dialog box.
On Windows 7 and earlier, open Folder Options in Control Panel, click the "View" tab, then select "Show hidden files, folders, and drives".
Double click on the dump file. As long as you have configured WinDBG according to the steps above, WinDBG will start and process the file.
Wait for the dump file to load. If this is your first time opening a dump file, you need to wait for the icon to load from Microsoft. Do not interfere when the WinDBG program downloads the file.
Next time, the dump file will load faster because you have downloaded the icon to the folderC:SymCache.
When seenFollowup: MachineOwnerat the end of the file means the file has finished downloading.
Find the line "Probably caused by" (Caused by). This is the fastest way to find out the cause of the error. WinDBG will analyze the dump file and report which driver or process is causing the problem. You can use this information to troubleshoot the problem or investigate further.
Find the BugCheck code. The dump file will respond with each error code when a system error occurs. Look for the code just below the line "Probably caused by". You'll see a 2-letter code, for example "9F".
Visit Microsoft Bug Check Code Reference. Find the code corresponding to BugCode according to 2 characters of each line.
You should read it
- How to fix corrupted memory dump file
- How to delete memory dump files in Windows
- How to fix common Windows 10 problems with WinDBG
- Use the WinDBG debugger to fix the blue screen error
- How to Read Dump Files
- What is DMP file? How to open DMP files in Windows 10
- Windows WinDbg debug tool has great improvements
- Analysis of Memory Dump file (* .dmp)
- 3 ways to configure BSOD crash dump on Windows
- How to open, run the .jar file on a Windows computer?
- Instructions to change DMG file to ISO file
- How to open and read the .DAT file?
Maybe you are interested
How to Run GUI-Based Applications in Docker How to turn off multiple message notifications on iPhone After more than 2 years of being announced, why is DisplayPort 2.0 still not really popular? Steps to Import data from different tables in MySQL Workbench How to install MySQL Workbench Community Edition on Windows 10 CastAway, an accessory that turns your smartphone into a folding screen in a flash, costs just over 3 million
