How to fix common Windows 10 problems with WinDBG
As a Windows 10 user, you may have encountered technical issues with your computer, ranging from poor performance to cryptic error messages that left you scratching your head. Fortunately, WinDBG can help you troubleshoot and fix any problems.
Table of Contents
The following article will guide you through the necessary steps to use WinDBG effectively. That way, you'll be able to troubleshoot and resolve technical issues with confidence on your Windows 10 PC.
Solve application crashes and crashes with WinDBG
If you are facing application crashes and crashes on your Windows 10 computer, here are the steps involved in using WinDBG to resolve the issue:
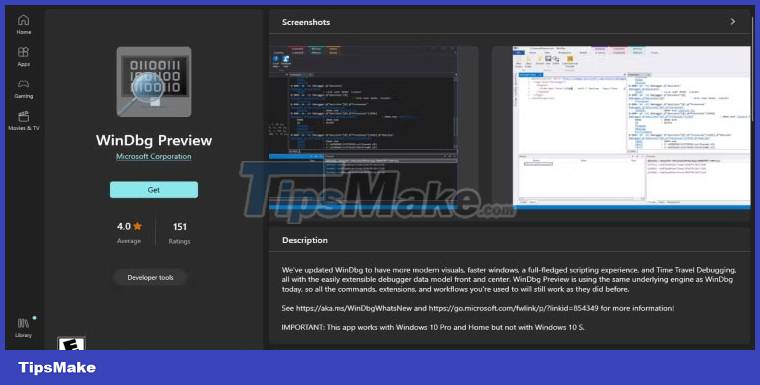
1. Install WinDBG
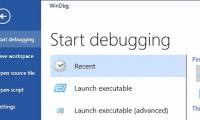
If you're just getting started with WinDBG, you'll need to download the app from the Microsoft website. Once you have downloaded the tool, install it on your computer.
2. Create dump file
When an application crashes, Windows creates a dump file that contains information about the crash. You must ensure that your PC is configured to create these files.
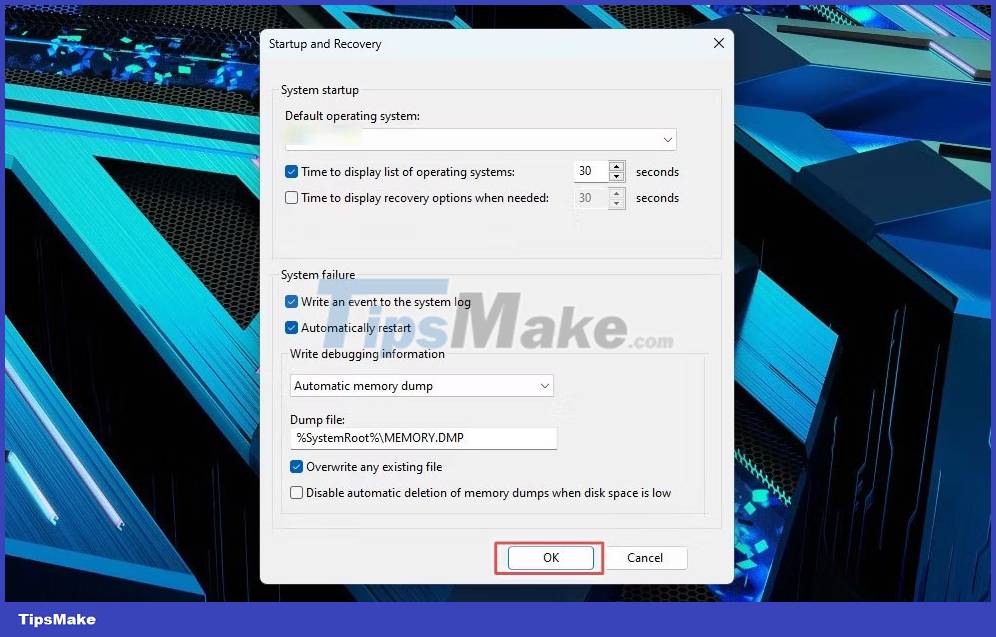
To do this, open the System Properties window and select the Advanced tab . Click Settings under Startup and Recovery , select the Write debugging information option and select Complete memory dump .
3. Load the dump file into WinDBG
Once you have the dump file, you can open it in WinDBG. To do so, open WinDBG, select File and click Open Dump File .
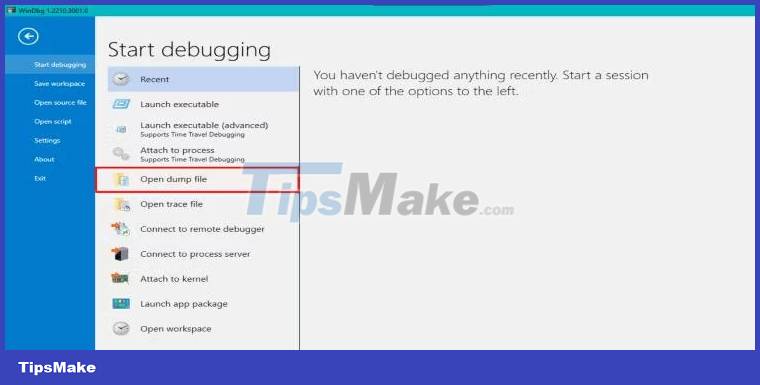
You will have no trouble finding the dump file on your computer. Open it and let WinDBG analyze the file, then display information about the problem.
4. Call Stack Analysis
The Call Stack is used to identify the function causing the problem. You can use the kb command in the WinDBG console to display the Call Stack.
Take a look at the function that appears at the top of the Call Stack. This is usually the function that causes the problem.
5. Determine the cause of the problem
Once you have identified the function that is causing the problem, you must analyze the code to determine what happened. Look for any incorrectly resolved pointers, empty pointers, or other memory errors.
You can also use the !analyze -v command to get more detailed information about the problem.
6. Troubleshooting
After determining the cause of the problem, fix the problem in the code and restart the application. If the problem is related to memory allocation, use appropriate memory management functions and follow memory management best practices.
7. Analyze unresponsive apps
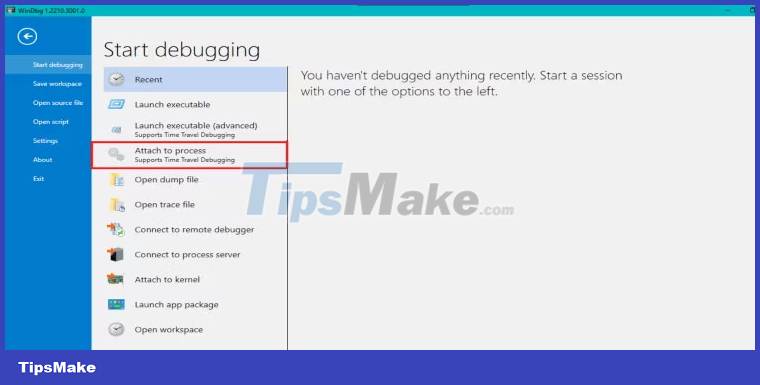
You can also use WinDBG to analyze and deal with unresponsive applications.
First, attach WinDBG to the unresponsive application process. Click Attach a Process in the File menu and select the process causing the problem.
After WinDBG is attached to the process, use the !analyze -hang command to analyze the hang. It will display information about threads in the process and any locks or resources being held.
8. Solve unresponsive apps
To resolve a frozen application, you must identify the correct thread causing the problem and find out what it is waiting for.
Look for any blocking function calls that prevent the thread from completing. You may need to modify the code to remove interceptor calls to avoid problems.
Diagnosing and Debugging Deadlock with WinDBG

Deadlocks can be annoying when working with Windows 10. They happen when two or more processes are stuck waiting to free up resources. As a result, no process can continue, causing the entire application to pause.
Below you will find convenient steps to help diagnose and debug deadlocks using WinDBG.
1. Find the source of deadlock
The first thing to do is find out which part of the computer is causing the deadlock error. Windows Task Manager, Resource Monitor, or Process Explorer can show which programs are stuck or unresponsive.
2. Get more information
Once you've identified the program that caused the deadlock, you need to gather more information to figure out what's going on. For example, you can collect data on the status of all deadlock-related threads and processes, as well as any related log files or error messages.
To gather this information, use WinDBG commands such as !process , !thread , and !locks , which provide deadlock related data. Another way to find error or warning messages is to open Windows Event Viewer, which records all events on a Windows 10 PC.
3. Data Analysis
The next step is to analyze the information gathered so that you understand why the deadlock occurs. You may need to look at the Call Stack or the memory value but don't worry if you don't understand everything. Use WinDBG commands like k , bp or dv to analyze and interpret the data.
4. Troubleshooting
Once you've found the cause of the deadlock, it's time to fix the error. This step may require changing the configuration or settings of the program that is causing the problem.
After making the necessary changes, use WinDBG to verify that the problem is resolved. Contact the program's support team for help if you're not sure what to do.
Debug long boot times or slow boot problems with WinDBG
If your computer has problems with boot times or slows down, it can significantly affect your productivity. These problems can be caused by hardware problems, outdated drivers, or software conflicts.
The following steps show you how to use WinDBG to fix slow boot times and other boot problems on Windows 10.
1. Configure the computer to create the Memory Dump . file
After installing WinDBG, you must configure your computer to create a Memory Dump file. Memory Dumps are files that contain a snapshot of your computer's memory at the time of a crash, and they can help you determine the cause of the problem.
To do this, press Windows key + R . Then type sysdm.cpl and press Enter to open the System Properties window . Then, click the Advanced tab, and then the Settings button in the Startup and Recovery section .
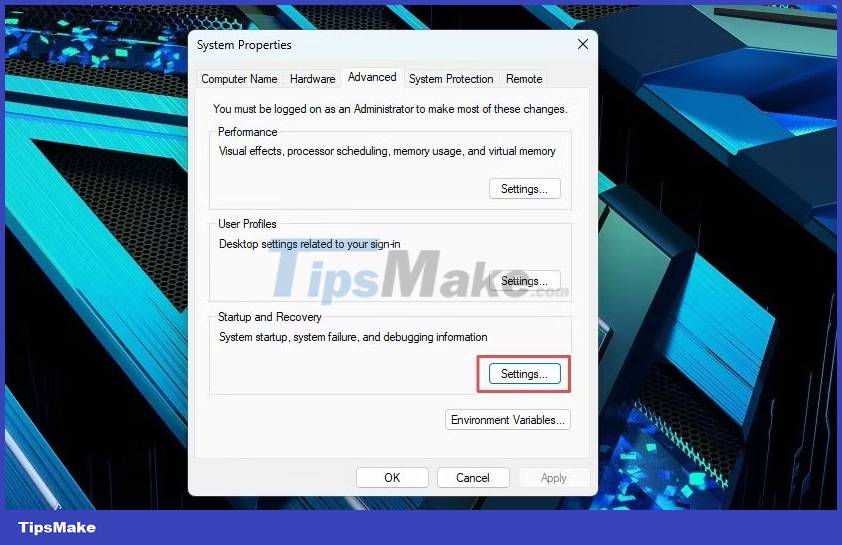
In the Startup and Recovery window , click the Write debugging information drop-down menu and select Complete memory dump . Then, choose a folder to save the memory dump files and click OK to confirm the changes.
2. Reproduce slow boot times or boot problems
To diagnose slow boot times or boot problems, you need to reproduce the problem by starting your computer as usual and waiting for the problem to occur. Your computer will automatically create a memory dump file that you can use to diagnose the problem.
3. Analyze Memory Dump with WinDBG
Once you have the memory dump file, open WinDBG and select File . Then, click Open Dump File and find the folder where your memory dump file is saved.
WinDBG will automatically analyze the Memory Dump file and summarize the problem. You can then use WinDBG commands to further look at the dump file and find the specific process or driver causing the problem.
4. Troubleshooting
After determining the cause of slow boot times or boot problems, you need to resolve the issue. This could involve updating drivers, uninstalling problematic software, or changing your computer's settings.
Solve slow network performance
Causes of slow network performance range from hardware failure to misconfigured settings. Therefore, the steps below will help you to solve this problem on Windows 10 using WinDBG.
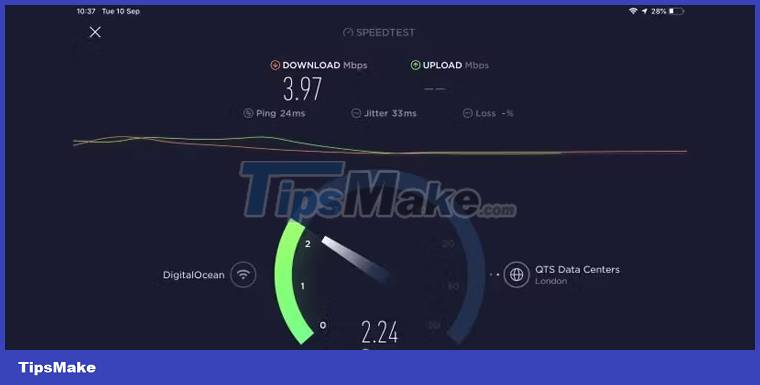
1. Identify the symptoms
The first step in addressing slow network performance is to identify the symptoms of the problem. This could include slow download or upload speeds, problems accessing websites, or other network connectivity issues.
2. Diagnostic data collection
You must collect data about your network to diagnose the root cause of slow network performance. This data can help you identify packet loss, high latency, or other network problems. You can also run diagnostics using the built-in Windows Network Diagnostic tools.
3. Analyze diagnostic data with WinDBG
To analyze the diagnostic data you just collected, use the analytics -v command in WinDBG to identify any network drivers or system components that are causing slow performance. You can also use the lmvm command to get more detailed information about these components.
4. Take action to fix the problem
This step involves updating your computer's drivers, changing network settings, or fixing problems with your network hardware.
Was this article helpful?
Your feedback helps us improve.
Related Articles
 Windows WinDbg debug tool has great improvements3 minutes read
 Use the WinDBG debugger to fix the blue screen error5 minutes read
 5 common network problems with Windows workstations16 minutes read
 4 common GPU problems and how to fix them7 minutes read
 Common problems on iOS 13 and how to fix them16 minutes read
 Learn About Windows Maintenance Tool: Free Tool That Solves the Most Common Windows Problems Easily6 minutes read
Reader Comments 0
Sign in with email or Google to join the discussion.