Compare Microsoft Excel and Power BI
Excel and Power BI are two very popular tools. Both offer a range of visualization and analysis tools to help you create dashboards and reports..
Microsoft Excel is great for analyzing data and making it easier to understand for everyday operations.
However, Power BI is specifically designed to make data more understandable, valuable, and actionable by connecting it with other business information - allowing you to discover insights. details quickly. In this guide, TipsMake.com.com will look at how these two apps differ and make recommendations for using them.
Key differences between Excel and Power BI

Excel is a spreadsheet application that provides powerful functions for manipulating, analyzing, and presenting data. You can create and modify spreadsheets, use formulas and functions, create charts and graphs, and import data from other sources.
Power BI is a business intelligence tool that helps you analyze metrics and quickly build interactive, visually appealing reports and dashboards. It is designed to help organizations make more effective decisions through real-time data insights.
You can connect all your data sources like CRM systems and databases in one place and create visualizations like charts, gauges, and maps. The article will take a closer look at some of their differences in the sections below. To get started, you need to sign up or download the app.
1. Data connectivity and integration
When it comes to Excel, you can import files from several types of data sources - files, databases, and web pages, as well as others. Both Excel and Power BI use Power Query to extract and fetch data.
To import the file into Excel, click the Data tab on the ribbon and use the Get data drop-down menu to choose one of the available options.
Power BI has an easy-to-use interface for data integration and analysis. You can import data into Power BI from a variety of online and offline sources including cloud services, databases like SQL and Azure, as well as plain text files. This application helps you convert any type of data into valuable business information in a fraction of the time.
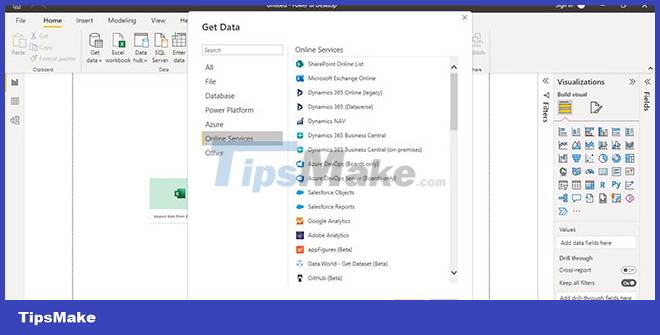
To import data into Power BI, click Get data > Get data from another source . Simply select the platform you want to import data from and click Connect. Sign in with your credentials (whenever required) to extract data from an external source.
Alternatively, you can import its commercially available visualization templates and use those that are available for free. Excel does not have this capability, instead, it provides almost exclusively static charts. Power BI clearly wins in terms of the sheer number of data sources it can connect to.
Winning Option: Power BIG
2. Reporting Features: Dashboard and Interoperability
While Excel has a powerful set of tools for data analysis, including pivot tables, Power BI offers more advanced charting and reporting options.
In Excel, you can choose from different chart types, such as line charts, pie charts, bar charts, stacked column charts, and PivotTable reports (which allow you to sort through sections. different data). You can also create your charts using Power Pivot or Power View (these functions have been removed from the latest versions of Excel or Microsoft 365), to display data in different ways.

Power BI reports can be used to generate meaningful insights from data, help you understand metrics about your business or organization, and make data-driven decisions. You can share those insights with your team and collaborate with them in decision making. Some of its outstanding features are:
- Tabular visualization using , and other tools.
- Dashboard tiles that you can move around and add information to.
- The ability to quickly filter, sort, and analyze your data through unique filters allows you to visualize trends across multiple dimensions.
While you can set up an interactive dashboard in Excel, its visualization capabilities can be a bit limited. In Power BI, you can also find many filters to add interactivity - through filters, manual filters, depth filters, etc.
Winning Option: Power BIG
3. The ability to automate and customize
Both Excel and Power BI have a ton of features that make them great for data analysis. But they also have some differences, especially when it comes to dashboard customization and automation settings.
To open the customization options in Excel, just click the Home tab. Right-click and choose Customize the Ribbon. You can then select the commands you want to display and add them to the ribbon.
Power BI helps you customize your dashboard by providing easy-to-find settings on the right side of the screen. Just click on Visualizations. From there, you can change things like the chart type or font size, or add interactive elements.
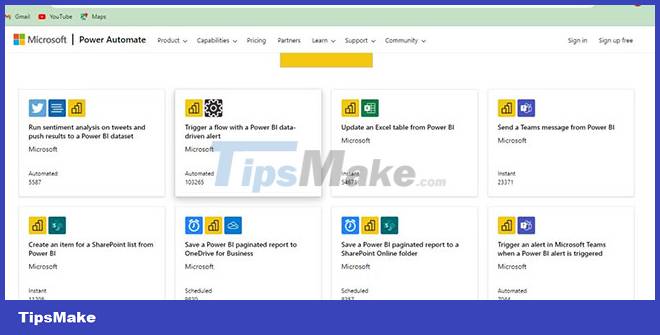
When it comes to automation, Power BI lets you set up custom workflows through Power Automate designed to help you easily perform complex tasks. Excel has a built-in tool called Visual Basic for Applications (VBA) that allows you to run macros (short programs) in a workbook. These macros can be used for a variety of purposes, including automating complex tasks.
Excel certainly has a slight edge when it comes to the plethora of customization options available to work with.
Winning Option: Microsoft Excel
4. Data Modeling and Language Dependency
Excel is all about the simplicity of organizing and analyzing data sets, while Power BI is fine-tuned to handle data from disparate sources while allowing complex models to be created.
Microsoft Excel is based on the MDX (Multidimensional Expressions) language, which is used to query and manipulate multidimensional databases. Power BI is based on a functional language called DAX, which stands for Data Analysis Expressions.
Excel provides a variety of data preparation methods - sort data, remove duplicate entries from a value list, merge multiple tables, and so on. You can also use filter and validation methods. Advanced Excel to select a specific subset of your raw data based on criteria that you specify.
Power BI, on the other hand, offers more features, based on a broad focus on data entry and analysis as well as storage capabilities. It can be used with any type of data source, including both structured and unstructured formats.
As noted above, it gives you the ability to quickly generate reports using visualizations and integration with third-party applications. You can organize your data, build relationships between different data points, and use that information to build models that help you predict future outcomes.
Winning Option: Power BIG
5. Collaboration Features
Microsoft Excel makes it easy to collaborate on projects by allowing you to send files via email, OneDrive, and other online services to team members.
You can track changes with notes and comments in Power BI and Excel. These collaboration tools are built-in so teams can work together on projects.
Power BI can help you create datasets. However, you will need to upgrade to the Pro version (starts at $9.99/month) to share and collaborate on reports.
To share your files, open the workspace and click on the file you want to share. When it opens, tap Share and enter the email addresses of the group member(s). You can also collaborate in real time using chat in Microsoft Teams.
Winning Option: Microsoft Excel
6. Cross-Platform Availability
If you're looking for a free tool to help you with everyday tasks, such as timesheets or tracking your sales and inventory, look no further than Excel. . After all, it's the most popular spreadsheet app.
If you are looking for a paid alternative, Power BI is a great choice. It has a free version that gives you access to many features, but if you need more advanced functionality or if your data includes complex formulas and functions then Power BI Pro or Plus is worth the investment. private.
Excel is available on computers and mobile devices. For Power BI, there are both free and paid options. However, you can only access Power BI's advanced features if you've signed up for a license.
Winning Option: Microsoft Excel
7. Price
Power BI offers the following packages:
- Power BI Pro: $9.99/user/month
Licensing individual users with modern, self-service analytics to visualize data with dashboards and live reports, and share insights across your organization. Power BI Pro is included with Microsoft 365 E5.
- Power BI Premium 1: $20/user/month 2
Licensing individual users to accelerate access to insights with advanced AI, unlock self-service data prepare for big data, and simplify enterprise-scale data access and management . Includes all features available with Power BI Pro.
- Power BI Premium 2: $4,995/productivity/month
Enable your organization to accelerate access to insights with advanced AI, unlock self-service data in preparation for big data, and simplify data access and management at scale. enterprise scale, without per-user licensing.
Excel is included in the Microsoft 365 plan, which has the following options:
- Microsoft 365 Business Basic: $3/user/month
- Try it for free for a month
- Separate web and mobile versions of Office apps
- Chat, call, meet with up to 300 people
- 1TB of cloud storage per user
- Business-grade email
- Standard security
- Support by phone and on the web at any time
- Microsoft 365 Apps for Business: $8.25 users/month
- Try it for free for a month
- Desktop versions of Office apps with premium features
- 1TB of cloud storage per user
- Standard security
- Support by phone and on the web at any time
- Microsoft 365 Business Standard: $10/user/month
- Try it for free for a month
- All features in Business Basic
- Desktop versions of Office apps with premium features
- Easily organize webinars
- Attendee registration and reporting tools
- Manage customer appointments
- Microsoft 365 Business Premium: $22/user/month
- Try it for free for a month
- All features in Business Standard
- Advanced Security
- Access and control data
- Protection against cyber threats
- Microsoft 365 Family: VND 1,799,000/year (suitable for 2-6 people)
- For 2 to 6 users.
- Use for up to 5 devices at once.
- Works on PC, Mac, iPhone, iPad, as well as Android phones and tablets
- Up to 6TB of cloud storage (1TB per person).
- Additional features in the Family Safety mobile app
- Microsoft 365 Personal: VND 1,299,000/year
- For 1 person.
- Use up to 5 devices at the same time.
- Works on PC, Mac, iPhone, iPad, as well as Android phones and tablets.
- 1TB of cloud storage.
It can be seen that Microsoft Excel has more flexible options
Winning Option: Microsoft Excel
Excel or Power BI is better choice?
If you are looking for a tool that allows your organization to analyze and visualize your data in real time, Power BI is probably your best bet. Its flexibility, ease of use, and the ability to create complex visualizations all set it apart from Excel. On the other hand, if you want an easy-to-use tool that allows you to quickly and easily create charts, then Excel may be more appropriate.