8 types of Excel charts and when you should use them
you have a presentation about to come and really want to impress the boss. you want to display data in a way that is easy to understand, but also intuitive and impressive. the

you have a presentation about to come and really want to impress the boss. you want to display data in a way that is easy to understand, but also intuitive and impressive. the

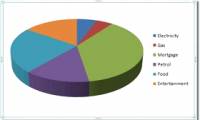
the chart is a very effective way of displaying data in computational or statistical programs, especially microsoft excel. in the tutorial below, we will cover the basic