How to use Fiddler to collect HTTP / HTTPS sessions for debugging
Fiddler is a free web debugging proxy that records all HTTP / HTTPS traffic between your web application and the Internet. Collecting session data with Fiddler can be useful for troubleshooting situations
Fiddler is a free web debugging proxy that records all HTTP / HTTPS traffic between your web application and the Internet. Fiddler session data collection can be useful for troubleshooting situations such as:
- When no user action is collected for an application, (JavaScript code Dynatrace is not infected with the virus and the signaling signal is not resent.)
- When a JavaScript error caused by the Dynatrace Real User Monitoring JavaScript code affects your application.
- In the absence of user actions (for example, a special interaction with the application).
Exported Fiddler sessions can be uploaded to the organization's incident management system (ie support) to facilitate problem solving.
- Use Wireshark to analyze data packets in the network
How to use Fiddler to collect HTTP / HTTPS sessions for debugging
- Use Fiddler to create an HTTP session of the monitored web application
- Alternatives to Fiddler sessions
- Use the Chrome Dev Tools to export the HTTP archive session
- Use IE Dev Tools to export NetXML sessions
Use Fiddler to create an HTTP session of the monitored web application
1. Download and install Fiddler.
2. If your web application uses HTTPS:
a. Open Fiddler.
b. Go to Tools> Fiddler Options and set the options boxes as shown below.

3. If your web application is an Android application:
a. Open Fiddler.
b. Go to Settings> Wi-Fi> Modify Network .
c. Set Fiddler as a Wi-Fi proxy, as shown below.

d. Go to Tools> Fiddler Options> Connections .
e. Find your IP workstation via the command line with ipconfig on Windows or ifconfig on Linux and the proxy port.
f. If your application uses SSL certificates, you must also add the Fiddler certificate to your device.
g. To add a Fiddler certificate to your device, go to Tools> Fiddler Options> HTTPS> Actions> Export Root Certificate to Desktop to get the Fiddler certificate.
hour. Save the exported certificate, usually named FiddlerRoot.cer on your Android device by going to Settings> Security> Install from SD card (where you copied it for the first time). You will then see a certificate in the USER tab of the Trusted credentials section.

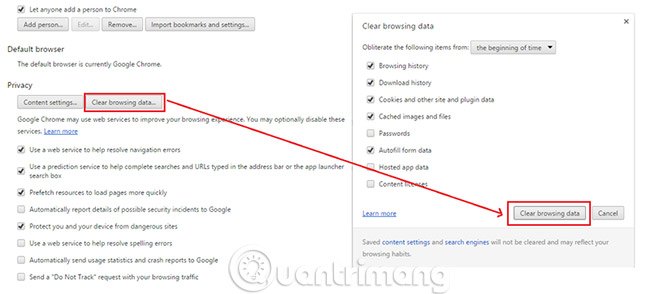
4. Turn off the collection feature so that the browser cache is cleared and start a new cycle.
a. Go to File> Capture Traffic or press F12.
b. Clearing the browser's cache will delete the cache entries and they must be downloaded again.
5. Begin to re-collect traffic and complete the problematic transactions on your site.
6. Once done, go to File> Save> All Sessions .
7. (Optional) Upload the file to the organization's incident management system to facilitate troubleshooting.
Alternatives to Fiddler sessions
Use the Chrome Dev Tools to export the HTTP archive session
Note: This alternative should only be considered a last resort. It is better to create a Fiddler session (mentioned in the previous section), because it is easier to replicate support cases.
In case it is not possible to use Fiddler to create sessions, Google Chrome can also export sessions to consider. Follow the steps below to collect HTTP Archive Session (HAR) files.
1. Open Google Chrome and clear your browser's cache.

2. Press F12 to open the Dev Tools.
3. Click the Network tab .
4. Complete transactions that have problems in your application.
5. After finishing, select all sessions, right-click on the blank space and select Save as HAR with Content from the menu.
(Optional) Upload to the organization's incident management system to facilitate problem solving.
Use IE Dev Tools to export NetXML sessions
Note: This alternative should only be considered a last resort. It is better to create a Fiddler session, because it is easier to replicate support cases.
Follow the steps below to export the NetXML session.
1. Open Internet Explorer 8+ .
2. Press F12 to open the developer toolbar.
3. Clear the cache and cookie domain.

4. Press the Play button (green triangle) to start.
5. Complete transactions that have problems in your application.
6. Once done, click the Export button (the drive icon with the arrow on the right) to save the file.
7. Upload files to the support system so that the person responsible for resolving the issues is considered.
See more:
- How to use Recoverit to recover data on your computer
- How to remove Bloatware on Android does not need root access
- Instructions for fixing Access Denied errors during file or folder access on Windows
Discover more
HTTP HTTPSShare by
Isabella HumphreyYou should read it
- Security in HTTP
- Caching in HTTP
- How to Execute HTTP POST Requests in Android
- What is HTTP
- Things you should know about HTTP / 2 protocol
- The Quiet Details That Make a Sports Betting Platform Feel Reliable
- Instructions on creating toy set images with ChatGPT AI
- How are AI agents changing the journalism industry?
- How to fix Unknown Hard Error on Windows 10
- How to fix the problem of left clicking on Windows
- How to fix the Touchpad does not click left and right