How to draw charts in Excel
Drawing diagrams on Excel are basic and often done, when displaying data based on tables or comparing figures together.
Table of Contents
Graphs in Excel are often used in cases where users need to compare the data in the table, in the most intuitive and easy-to-see way. Instead of presenting the text, listing the numbers, we can go through the graphs to represent those figures. Excel provides users with chart types including column charts, flow charts, pie charts, bar charts, area charts, scattering charts and a number of other chart types. The following article of Network Administrator will guide you how to create charts on Excel.
We will proceed to create a chart with the data table as shown below.

1. Draw a chart in Excel
Step 1:
First you will black out the entire table and then click on the Insert tab, then look at the Charts section to see the types of graphs that represent the data to choose from. Click on the arrow icon to open the chart table.

Step 2:
Show Insert Chart interface with chart types for users to choose. Select a chart type and click OK below. We will immediately see the chart appear in the Excel interface.

Depending on the data table, we choose the chart accordingly.
- Column: vertical bar graph format showing data changes over time or comparison between items. There are different chart types such as 2D column chart, 3D column chart, stacked column chart and 3D stacking column.
- Line: a line chart that represents time with markers at each data value. There are many types of charts such as: line charts, marked line charts, stacked line charts, 3D line charts .
- Pie: pie chart, representing percentage data.
- Bar: horizontal bar chart, similar to Column format.
- Area: Area chart is used to indicate the change over time, focusing on the total value.
- XY (Scatter): XY dispersion chart, used to compare data values in pairs.
- Stock: stock chart, illustrating fluctuations in stock, rainfall, temperature .
- Surface: the optimal surface combination chart between data sets, colors indicate areas of the same value range.
- Donut: The ring chart advises the relationship between the parts with the total.
- Bubble: a bubble chart is a kind of graph (tan), this chart is used a lot in market research, financial analysis.
- Radar: spider web format displays multivariate data, often used to determine performance and identify strengths and weaknesses.
2. Edit charts in Excel:
After creating the basic chart with the data given in the table, we will proceed to edit the information for the chart, as well as change other content.
1. Chart editing tool
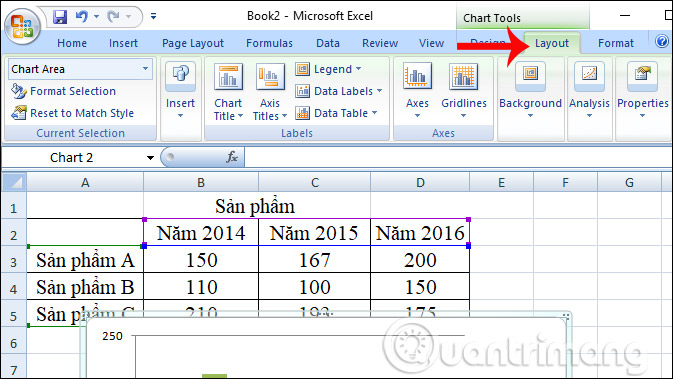
When clicking on the chart just created, the toolbar will appear 3 editing tabs including Design, Layout and Format .
The Design tab is where users can change chart types (Change Chart Type), chart layout (Chart Layout), change data for charts (Switch Row / Column), colors for graphs ( Chart Styles.

To change the data in the chart, we select Select Data. A dialog box appears at the Select Data Source so you can change the data in it.

Layout tab to insert photos, images and text, labels, titles . for charts.
To add a title to the chart , we click on Chart Title then select Above Chart. Enter the name of the chart and press Enter.

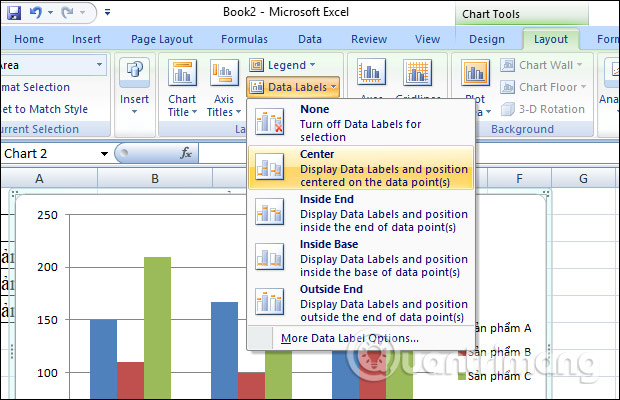
To add a label, data for columns select Data Labels and select the location to display the label.
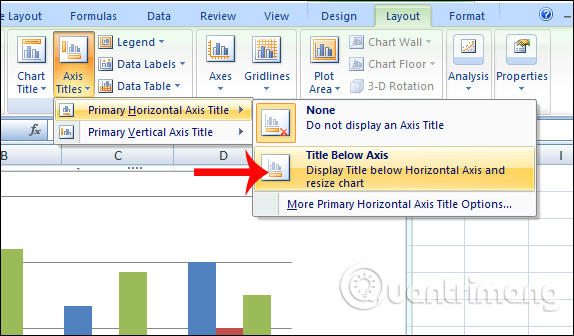
To add a title to the axis in the chart select Axis Title and then select the type to enter the content. For example, when you want to create a caption for a horizontal axis, a horizontal axis, click Axis Titles> Primary Horizontal Axis Title> Title Below Axis.
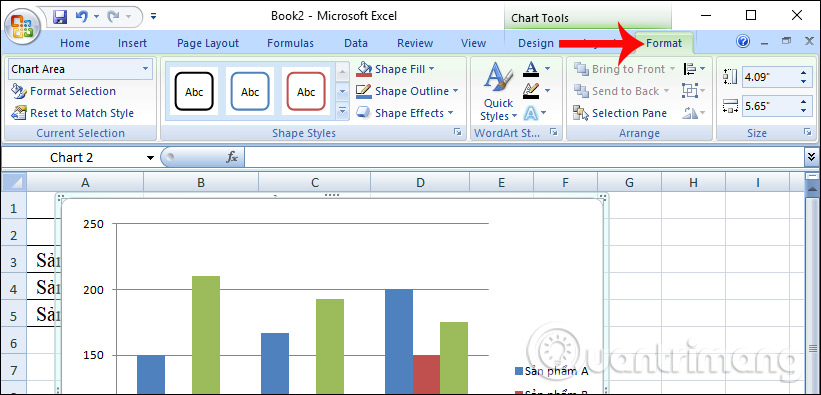
Format tab to edit the style, font style and size for the chart.
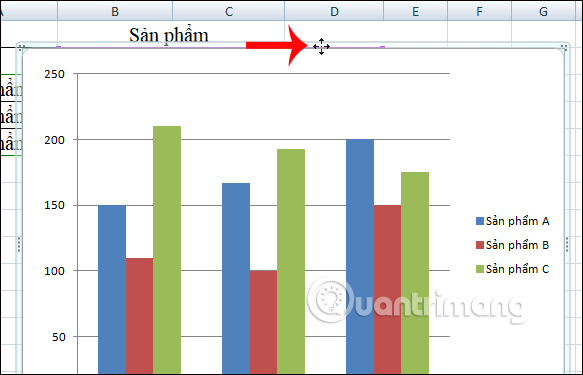
2. Move the Excel graph
Click on the chart when the mouse pointer has 4 arrows , press and hold the left mouse button to move the chart to another position.
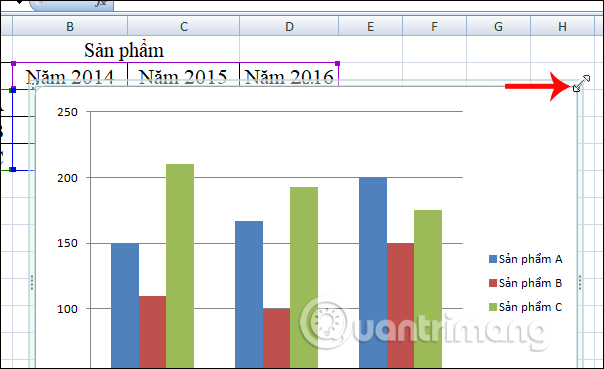
3. Change the Excel graph size
Clicking on 1 of the 4 corners of the graph will show a 2-way arrow . Click and hold the left mouse button and stretch or shrink to resize the chart.
4. Print the graph on Excel
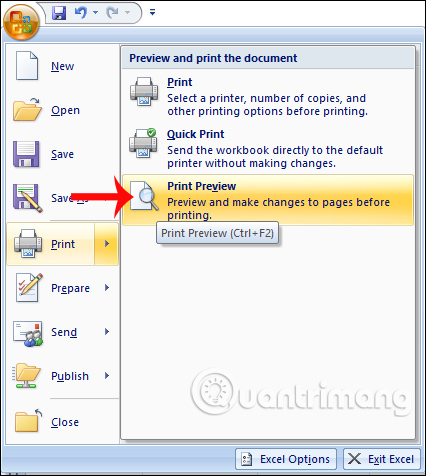
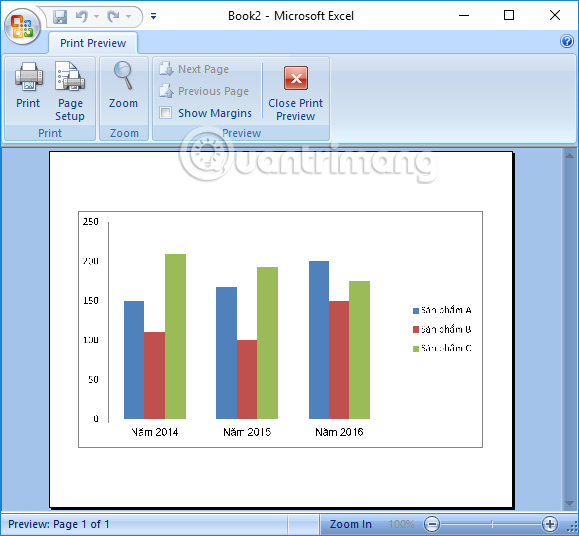
Printing charts on Excel is as simple as printing other documents. We can print the graph with the data sheet, or print the graph separately. To print the graph together with the table , click on the Office icon and select Print . Before printing, click Print Prview to check the print panel again.
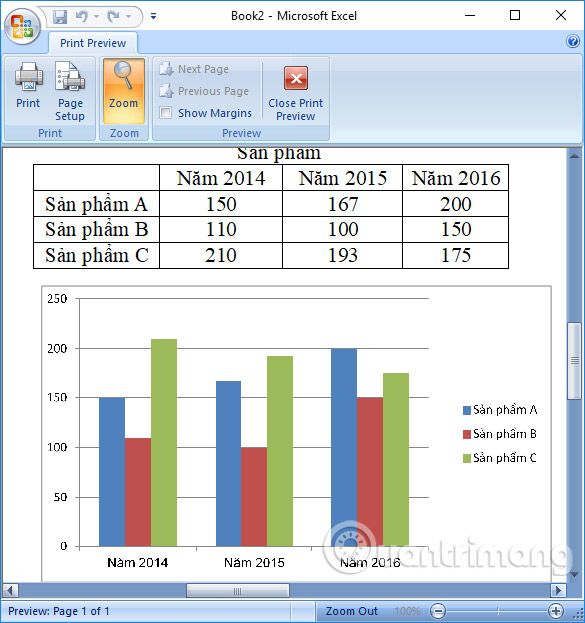
The print page will display the content as shown below.
If you want to print the Excel chart separately , click on the graph, and click Print to print.
The above is the operation to create a chart on Excel, as well as how to edit the chart. In general, creating charts on office tools such as Excel, Word or PowerPoint will be the same. After creating, depending on the need for expression, we add other content to the chart.
I wish you all success!
Was this article helpful?
Your feedback helps us improve.
Related Articles
 How to draw a pie chart in Excel 20163 minutes read
 How to draw a map chart on Excel4 minutes read
 How to create 2 Excel charts on the same image4 minutes read
 How to draw charts and graphs in Excel simply and quickly2 minutes read
 Instructions for drawing charts with AI accurately and quickly2 minutes read
 How to draw flow charts in Excel12 minutes read
Reader Comments 0
Sign in with email or Google to join the discussion.