How to draw straight lines and arrows in Excel - Draw shapes in Excel
There are many different ways to draw straight lines and arrows in Excel. Lines and arrows in Excel are often used to draw mind maps in Excel or graph functions in Excel.
Table of Contents
Below are detailed instructions for drawing straight lines and arrows in Excel.
Instructions for drawing arrows in Excel
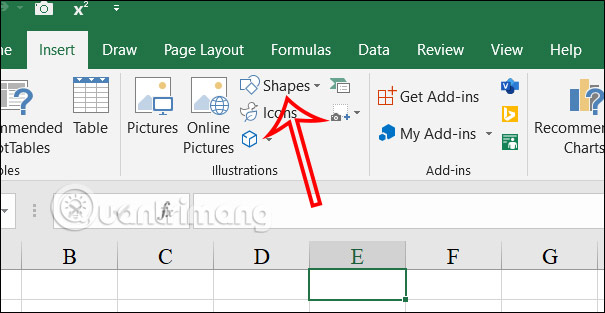
Step 1:
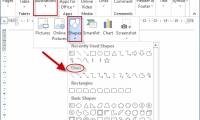
We click Insert then click Shapes to display the shapes in Excel.
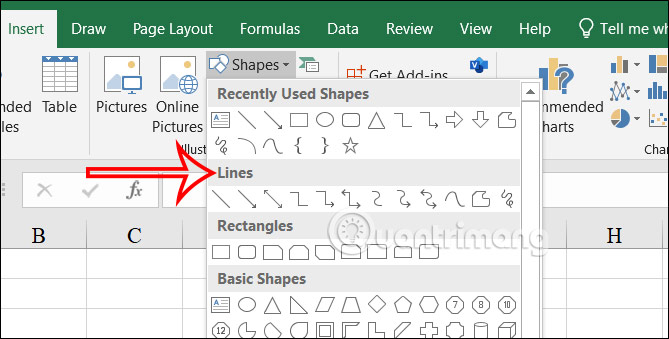
Step 2:
In the Lines section, find the arrow you want to use in Excel , a 1-way arrow or a 2-way arrow to insert into the content.
Step 3:
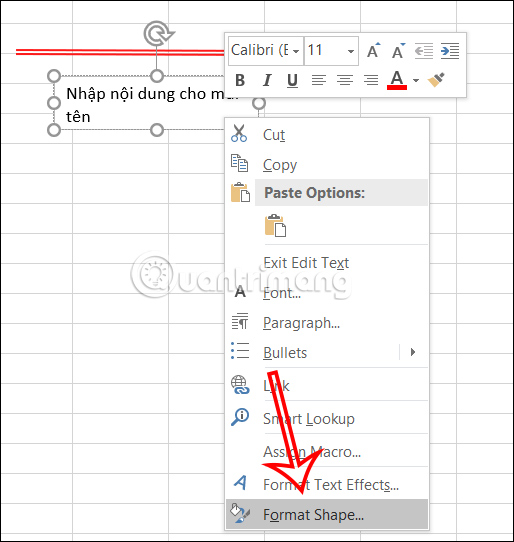
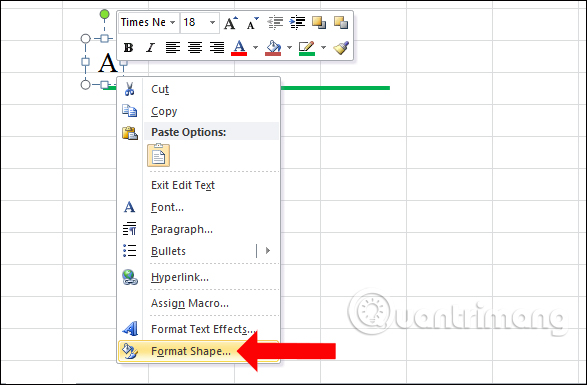
Right -click on the drawn arrow in Excel and select Format Shape displayed in the list.

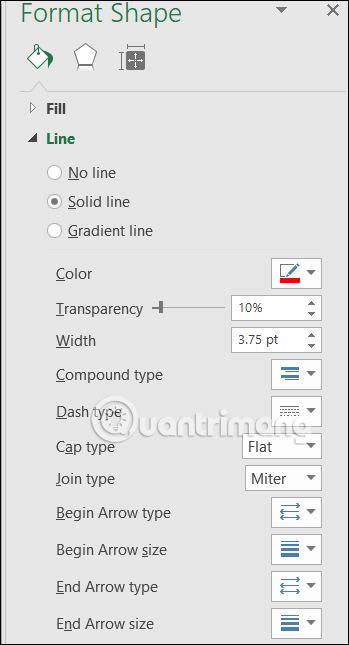
Step 4:
Displayed on the right edge of the interface are options to change the drawing arrow interface in Excel.
- Color: Adjust the color of the arrow.
- Transparency: Adjust the opacity of the arrow.
- Width: Thickness for the arrow.
- Compound type: Create a style with multiple lines
- Dash type: Arrow type.
- Begin Arrow type: Edit the shape at the tip of the arrow.
- Begin Arrow size: Adjust the size of the arrowhead
- End Arrow type: Edit the shape at the end of the arrow.
- End Arrow size: Adjust the size of the end of the arrow.
We will click on each item to change the display interface for the arrow in Excel.
Step 5:
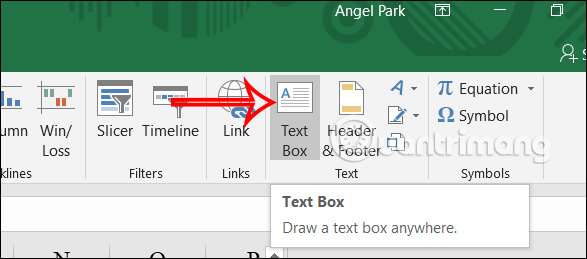
To write text on the arrow , click on the Text Box in the Insert section to write.
We will draw a frame at the position where we want to write the text in the arrow. Next, enter content into the frame and then right-click and select Format Shape .
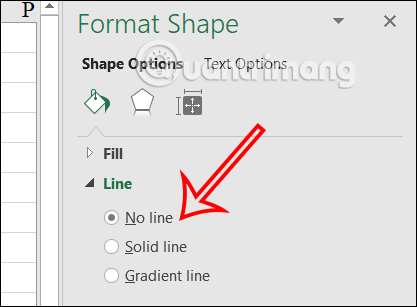
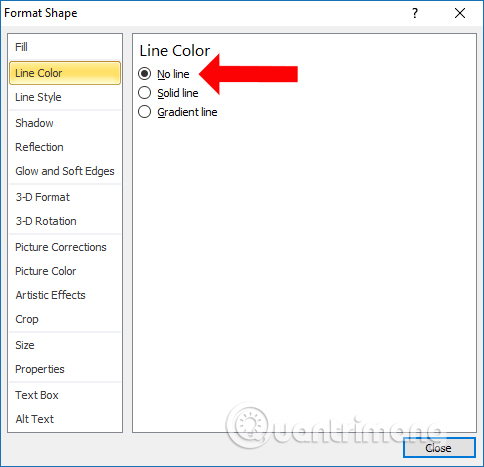
Step 6:
Continue to click No Line in the Line section to remove the border.
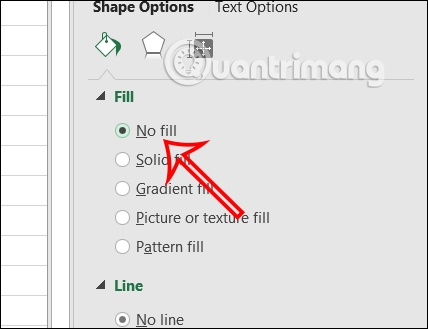
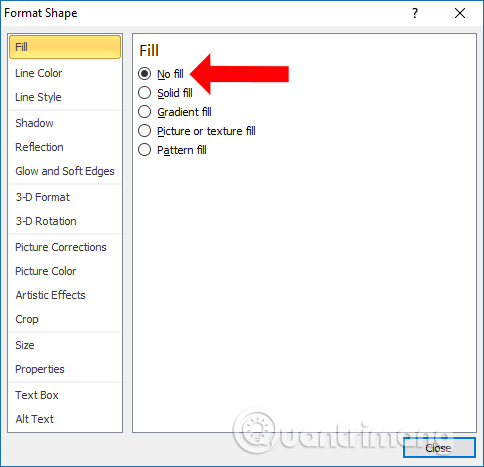
At Fill , select No fill to remove the background in the Textbox frame.
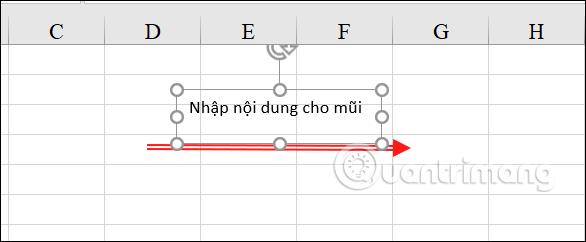
As a result, you have an arrow with the content displayed as shown below. We can adjust the content display position to match the arrow.
Step 7:
To make it easier to adjust the position of the arrow, press the Shift key, then click on the arrow and text, then right-click and select Group to group the objects into 1. So when you move, the arrow will move. and writing.
Instructions for drawing straight lines in Excel
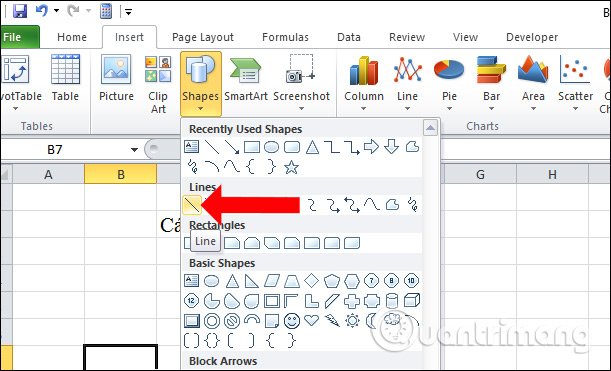
Step 1:
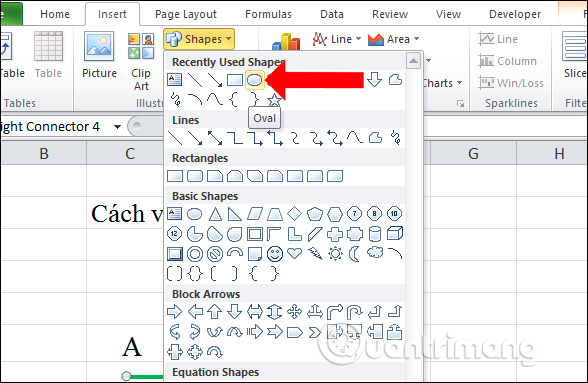
In Excel content, click on the Insert tab and then click on the Illustrations group . Select the Shapes section to represent drawings in Excel. Here in the Line section , users click on the first line.
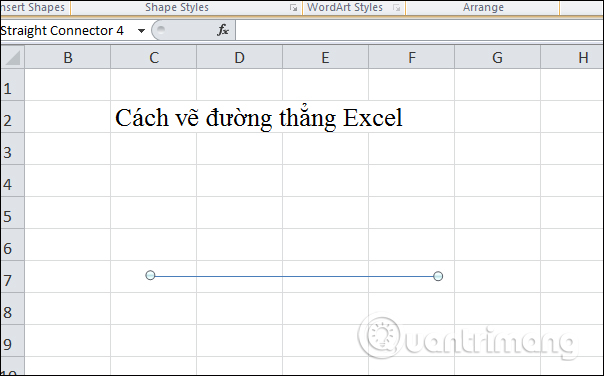
Step 2:
Click in a cell and then drag the mouse to the right to create a straight line. When you release the mouse, you will see 2 endpoints at both ends of the line. Note that while drawing, hold down the Shift key so that the drawing line does not break.
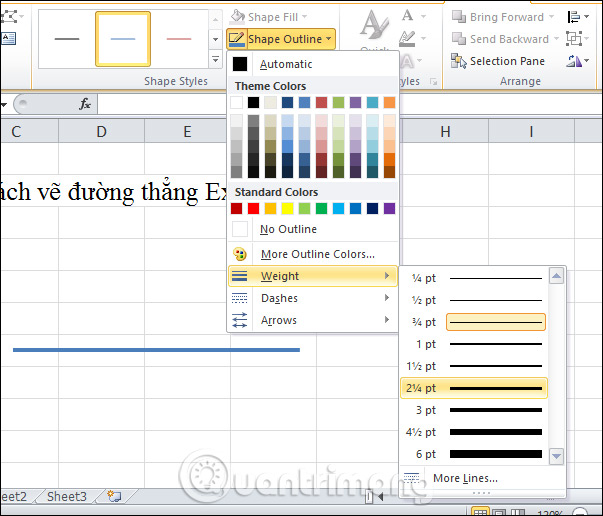
Step 3:
After creating the line, we will customize the thickness of the line, click on the line we just drew, then click the Format tab , select Shape Outline and select Weight to choose the thickness for the line.
When hovering over the thickness size, it will be applied immediately on the line for the user to know.
Step 4:
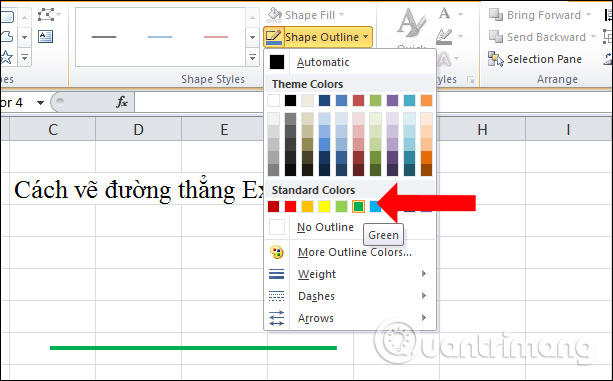
To change the color of the line, we also click on Shape Outline and then select the color we want to use for the line.
Step 5:
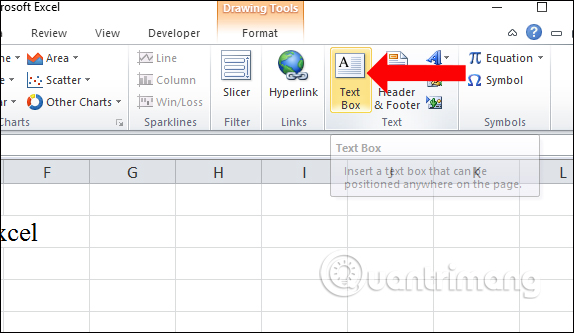
Once you have created the line and edited it, you need to insert text at the 2 endpoints of the line. Click the Insert tab , then find the Text group, select Textbox .
Step 6:
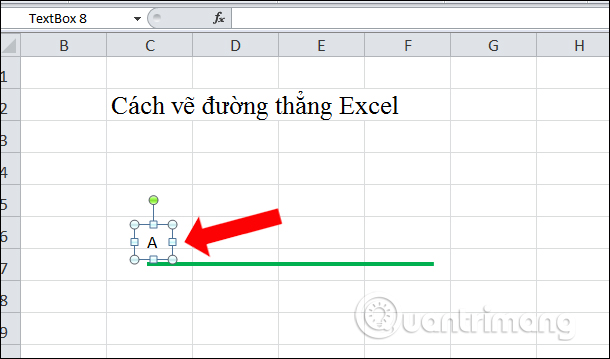
Click and hold the mouse in the direction you want to create the Textbox, which here are the two starting points of the line, enter content for the text.
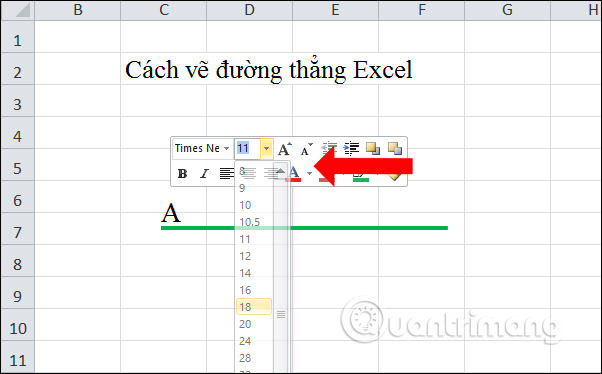
To change the font and font size in the Textbox, highlight the text and select the formatting style in the small dialog box that appears. You can also re-adjust the position of the text on the two ends.
Step 7:
Next, remove the border and background for the Textbox, right -click on the Textbox and select Format Shapes .
Step 8:
Display the new interface, in the Line Color section, click No Line .
Next to the Fill section, click No Fill .
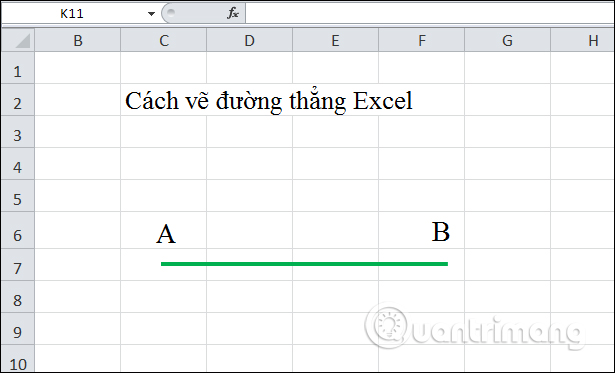
Then continue to create a Textbox with the remaining end and name it B to get the straight line AB as shown.
Step 9:
The 2 tips will disappear when you click outside the content. To create a line segment blocking the start and end points, click on Shapes and select the Oval ellipse to add 2 endpoints to the line.
We will get an ellipse like below. The next thing is to stretch the frame to form a circle and move it to the beginning of the line to create the endpoint.
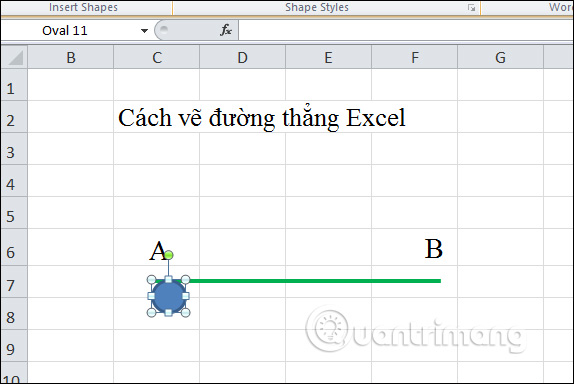
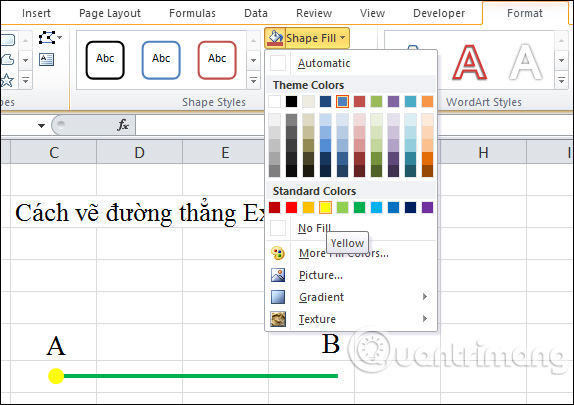
Step 10:
So you will get 1 sucking point as shown. Click Format and then edit the color for the endpoint at Shape Fill and Shape Outline .
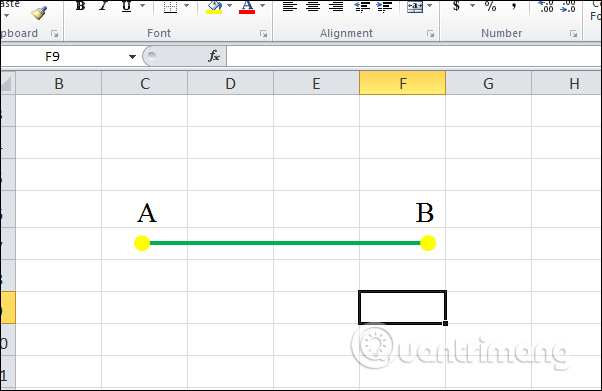
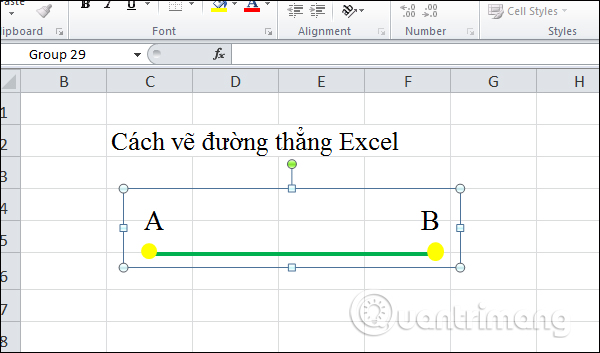
Create the remaining endpoints and get a line segment AB as shown.
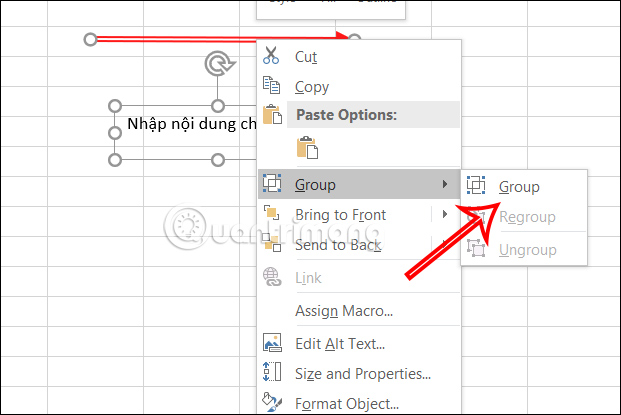
Step 11:
To move the line segment and the objects in the line, the user needs to group the objects in the line into a common object.
Hold down the Shift key and then click on the objects in the image. Then right-click on any object and select Group , then select Group to group them.
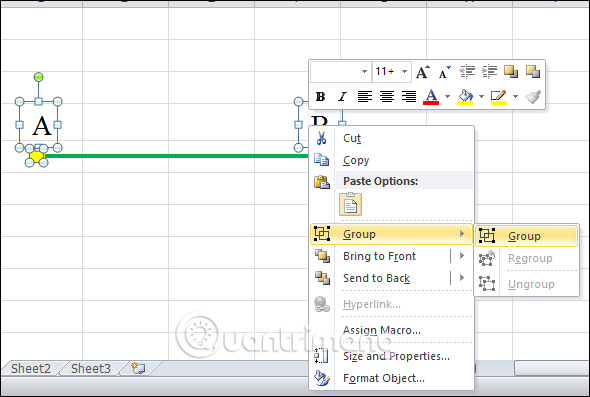
When the group is successful, there will be a border surrounding the line.
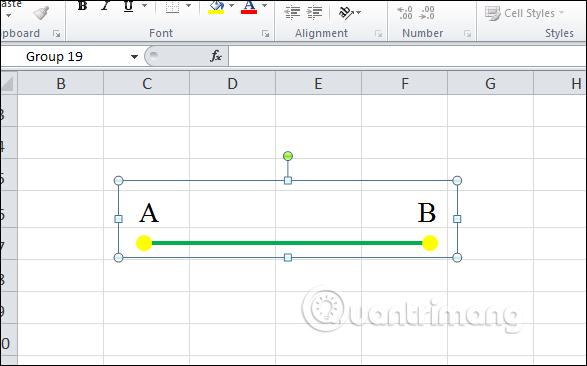
Thus, users can move the line segment without changing the position of objects in the image.
Was this article helpful?
Your feedback helps us improve.
Related Articles
 Instructions for drawing straight lines in Word4 minutes read
 How to draw straight lines and lines in Word 2019, 2016, 2013, 2010 and 20073 minutes read
 How to draw broken lines in Word4 minutes read
 How to draw straight lines, curves in Photoshop3 minutes read
 How to draw arrows in Word2 minutes read
Reader Comments 0
Sign in with email or Google to join the discussion.