Top 5 best organizational chart software today 2020
Looking for an easy-to-use, professional organizational charting software but confused between the options? The following article will introduce you to the top 5 best organizational chart software today. Hope you can find what you want..
Looking for an easy-to-use, professional organizational charting software but confused between the options? The following article will introduce you to the top 5 best organizational chart software today. Hope you can find what you want.
What is organizational charting software?
An organizational chart is a diagram that shows the management structure and organizational hierarchy of a business. Organization charting software lets you record hierarchies in your company. A good diagram software must provide detailed features to see multiple levels of management. Charting tools can be free for one user, or cost hundreds of dollars per month, depending on the size of your company and the number of organizational charts you build.
Top 5 best organization chart software
1. Pingboard
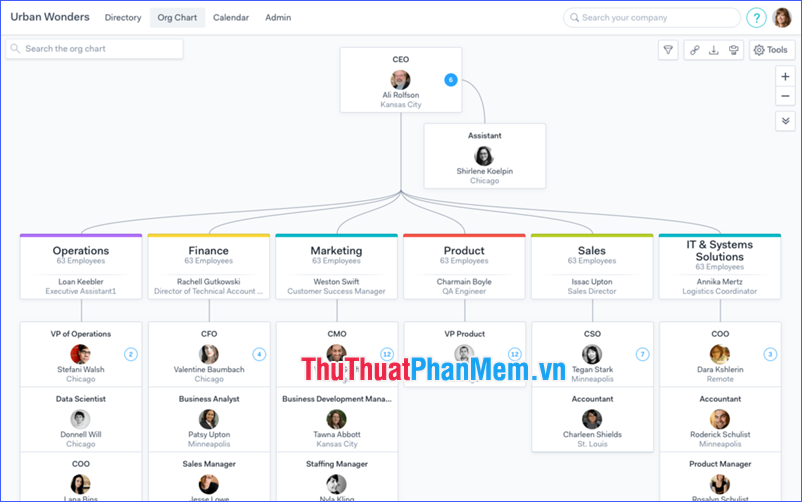
Pingboard is the best overall software for small businesses. If you have fewer than 50 employees, Pingboard is completely free. In addition, Pingboard also integrates with human resources (HR), payroll and other business software platforms, meaning you do not need to maintain redundant data. When updating employee data in a system, it will move to other software with intact job titles and monitoring relationships.
Homepage link: https://pingboard.com/
Features of Pingboard:
- Many separate organizational chart;
- There are mobile apps for iOS and Android;
- Group cooperation;
- Share link;
- Export organizational chart;
- Multifunctional organization chart;
- Support decentralized organizational structure.
2. OrgWeaver

OrgWeaver is the best free organizational chart software if you have fewer than 20 employees and only need to create a few charts. OrgWeaver's free package allows you to enter staff lists, change colors to match your brand, print organizational charts and export them to presentation software like PowerPoint.
Homepage link: https://orgweaver.com/
Features of OrgWeaver:
- Cloud-based solution;
- Automatic format;
- Drag and drop function;
- Instant cooperation;
- custom colors;
- Search;
- Custom filters;
- Easily publish and share links;
- Flexible support.
3. Lucidchart

Lucidchart is added to the list of best organizational charting software because it comes with great organizational chart templates, and you can even enter your employee data. In addition, if you also work like most businesses, the organization chart will not be the only type of diagram you need to create. Owning Lucidchart means having a complete charting and charting software, which comes with almost every kind of organizational chart template you can imagine.
Homepage link: https://www.lucidchart.com
Features of Lucidchart:
- Drag and drop function;
- Rich sample library and drawings;
- Group cooperation;
- Revision history;
- Embedded documents;
- Data encrypt;
- Strong backup;
- Import / export with Visio.
4. Organimi
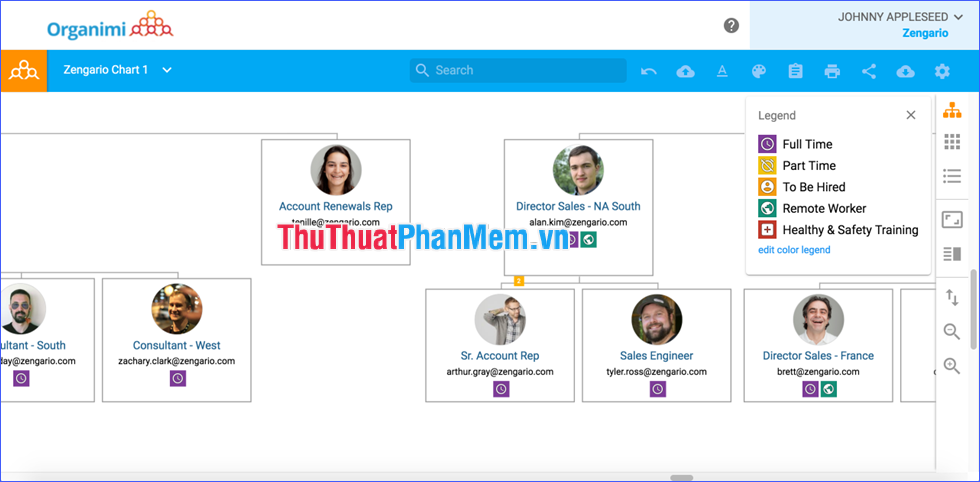
Organimi is great for businesses that want to customize the data displayed on their organizational chart. You can create up to four custom data fields for separate items that only your company tracks, such as each employee's pet name, favorite snacks or their driver license type. . Organimi also offers many sharing options for users, such as sharing online as a public link, posting to a personal blog as HTML code or saving only PDF.
Homepage link: https://www.organimi.com
Feature of Organimi:
- Drag and drop function;
- Custom fields;
- Smart chart function;
- Photoboard and integrated directory;
- Print and export to PDF, PNG and PPT;
- Share link.
5. OrgChart4U
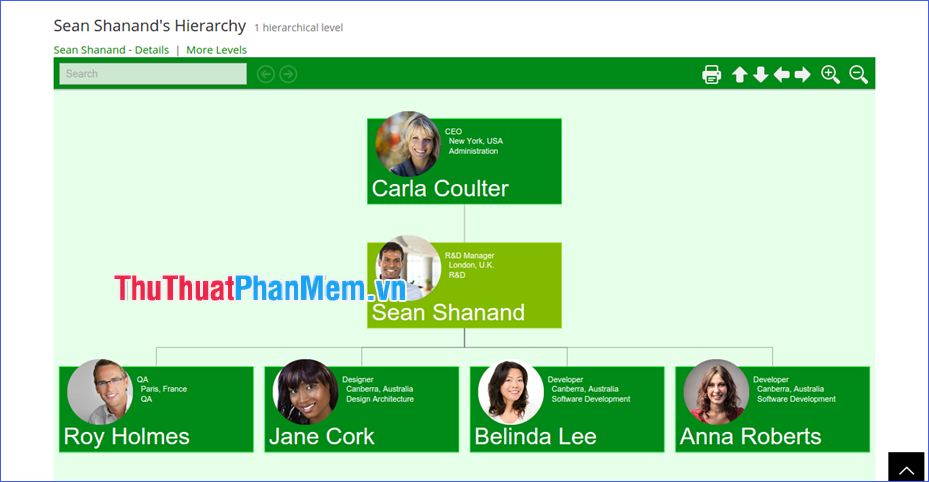
OrgChart4U is the best option for businesses who want to access their organizational chart through a mobile device. In addition to the organizational chart, it also provides a social utility and employee directory. You can view employee photos on the screen via smartphone and also view employee details data from the directory. That is very helpful if you or your staff frequently leave the office.
Homepage link: https://www.orgchart4u.com/
Features of OrgChart4U:
- Employee directory;
- Advanced search and tagging;
- Multi-level hierarchical display;
- custom colors;
- Security and authorization;
- Bulk upload;
- Bulk invitations for employees;
- Print and output functions.
Through the article above, I have introduced the top 5 best organizational charting software today. Each software has its own strengths, suitable for different needs. Wish you find a satisfactory software!