Create descriptive statistics table for dataset in Excel
In Excel supports user statistical analysis tools. Here I introduce you how to create descriptive statistics tables for data sets in Excel.
Table of Contents
In Excel supports user statistical analysis tools. Here I introduce you how to create descriptive statistics tables for data sets in Excel.
In case the device does not have Analysis Toolpak installed, follow the instructions of Part 1. Install Analysis Toolpak if already installed, follow the instructions from Part 2. Create a statistics table .
1. Install Analysis Toolpak
Step 1: In card File-> Options -> dialog appears -> Add-Ins -> Analysis ToolPak -> Go.
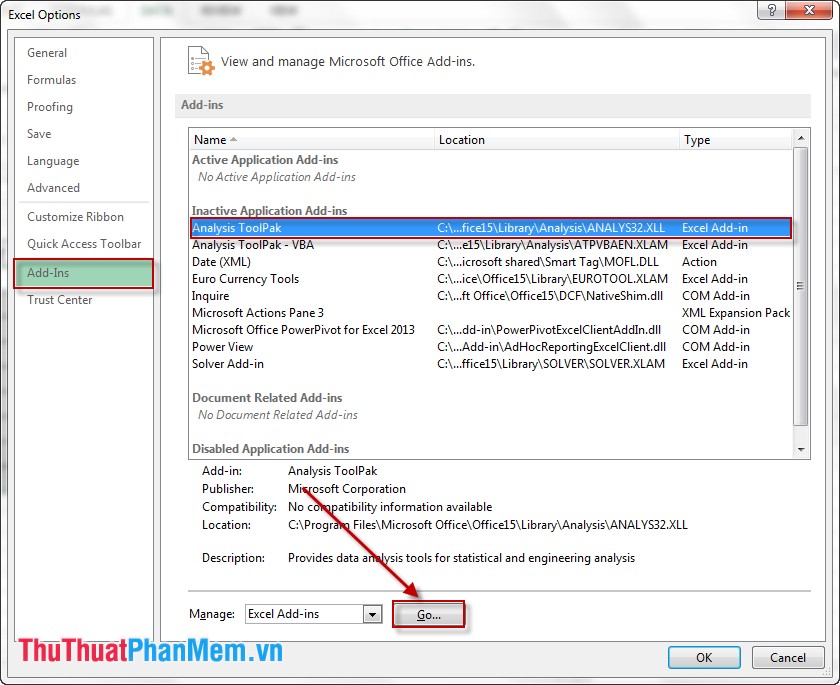
Step 2: The Add-Ins dialog box appears -> Analysis Toolpak -> OK .

So you have installed Analysis Toolpak for Excel.
2. Create data statistics table
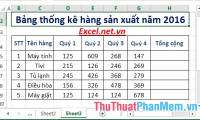
I have the following data table, I want to statistic about the sales and which products sell the best.

Step 1: Click Data -> Data Analysis . The Data Analysis dialog box appears, click Descriptive Statistics -> OK .
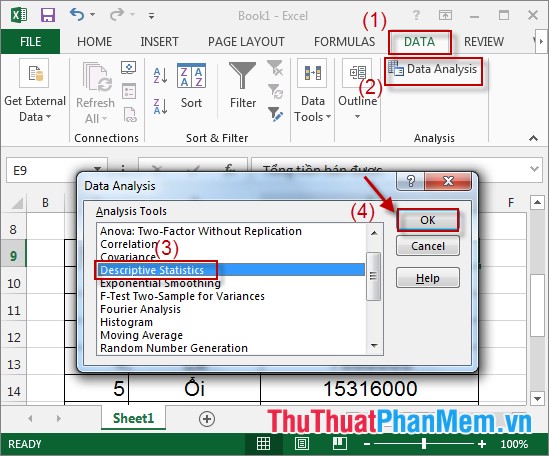
Step 2: Dialog Descriptive Statistics appears -> select the data that you want statistics in Section Input Range -> select the location of the statistics table in section Output Range -> tick Summary Statistics -> OK.

Step 3: Completing the statistics table (as shown)

We see Excel for some basic statistical quantities as follows:
1. Mean: The average value
2. Standar Error: Error of mean
3. Median: Median
4. Standar Deviatic: Standard deviation
5. Variance: Variable length
6. Maximum: Maximum value
7. Minimum: Minimum value.
Hope the data sheet will help you.
Good luck!
Was this article helpful?
Your feedback helps us improve.
Related Articles
 Practical exercise on production statistics table in Excel2 minutes read
 How to view Workbook Statistics in Excel2 minutes read
 How to create a table, insert a table in Excel 20168 minutes read
 How to use Excel Online online for free4 minutes read
 How to create a Kanban table in Excel7 minutes read
 How to create spaces between letters and cell borders in Excel3 minutes read
Reader Comments 0
Sign in with email or Google to join the discussion.