QUARTILE function - The function returns the quartile of a dataset in Excel
The quartile is an indispensable value in the field of surveying and sales, it helps you evaluate certain criteria in a set. The following article details how to use QUARTILE function, the function returns the quartile of a dataset.
Table of Contents
The quartile is an indispensable value in the field of surveying and sales, it helps you evaluate certain criteria in a set. The following article details how to use QUARTILE function, the function returns the quartile of a dataset.
Description: The function returns the quartile of a dataset. It is applied in survey and sales data.
Syntax: QUARTILE (array, quart) .
Inside:
- array: The data set (by array or range of cells) wants to find the quartile value, is a required parameter.
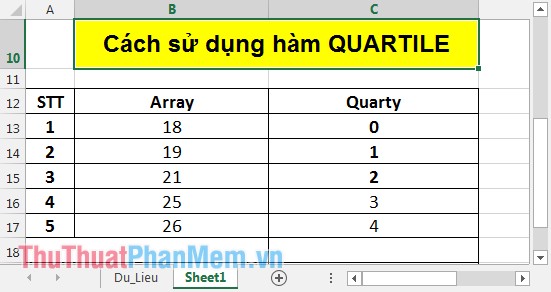
- quart: Specifies the value to return, is a required parameter. There are the following levels:
+ quart = 0: Quartiles at minimum.
+ quart = 1: The first quartile (25th percentile).
+ quart = 2: Quartile at average value (50th percentile).
+ quart = 3: Quartile at the third value (75th percentile).
+ quart = 4: Quartile at maximum value.
Attention:
- If array parameter is empty => the function returns the value #NUM!
- If quart is decimal => function takes integer value of quart.
- If quart is outside the value set {0, 1, 2, 3, 4} => the function returns the #NUM! Error value
- In case quart = 0 => has the same value as MIN function, quart = 2 => has the same value for MEDIAN function, quart = 4 = same value for MAX function.
For example:
- Calculate the percentile value of the following data set:
1. Minimum percentile
In the cell to calculate enter the formula: = QUARTILE (B13: B17, C13) .
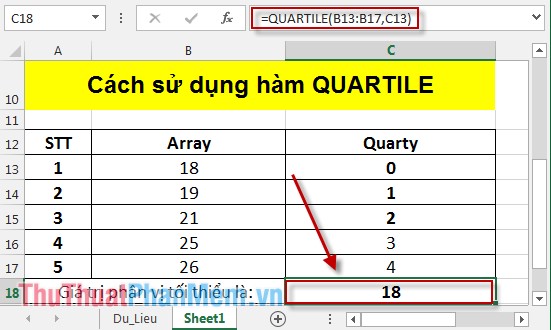
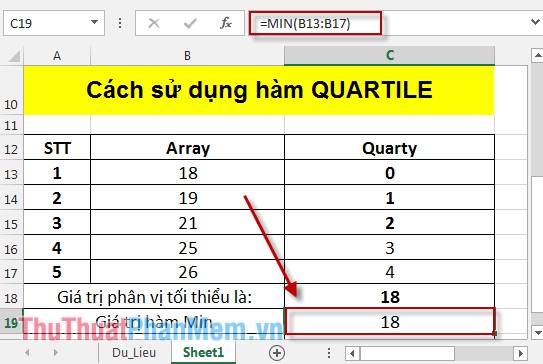
The minimum percentile has the same value as the MIN function:
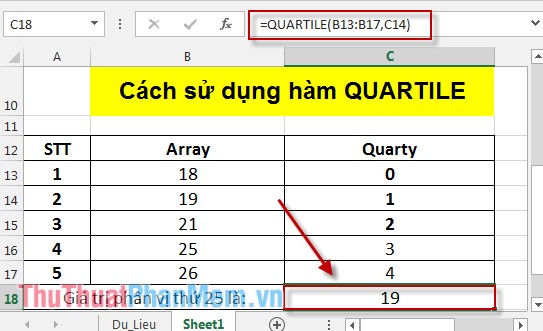
2. 25th percentile (quarty = 1)
In the cell to calculate enter the formula: = QUARTILE (B13: B17, C14) .
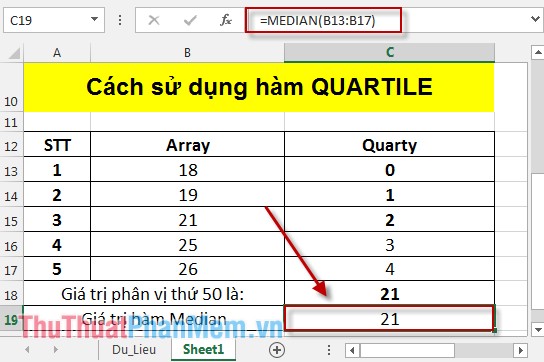
3. 50th percentile
In the cell to calculate enter the formula: = QUARTILE (B13: B17, C15) .
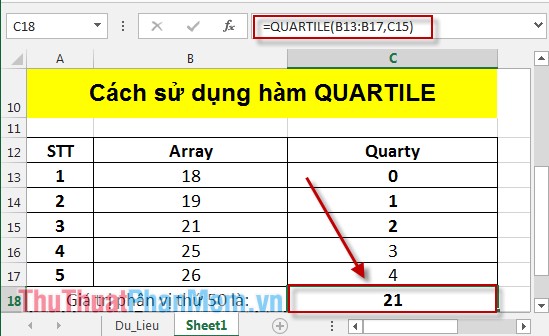
The 50th percentile has the same value as the MEDIAN function.
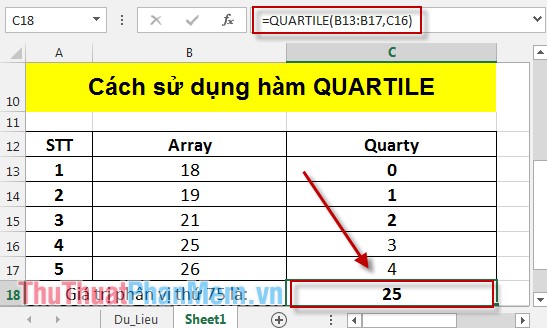
4. 75th percentile
In the cell to calculate enter the formula: = QUARTILE (B13: B17, C16) .
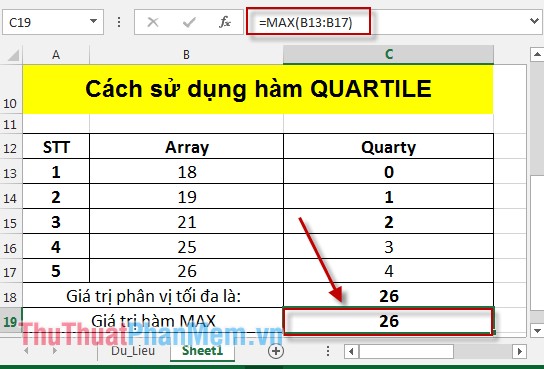
5. Percentage with maximum value
Enter the formula: = QUARTILE (B13: B17, C17) .
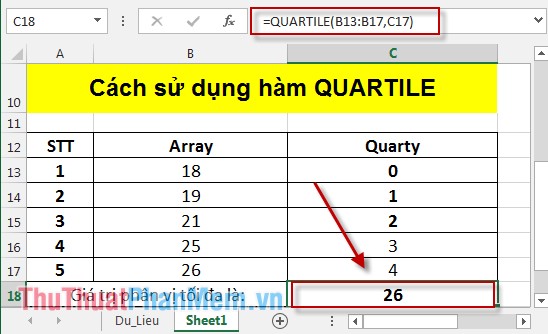
Maximum percentile value equal to the MAX function value:
The above is a detailed guide of usage and special cases of Quarty function.
Good luck!
Was this article helpful?
Your feedback helps us improve.
Related Articles
 QUARTILE.EXC function - The function returns the quartile of a dataset without values 0 and 1 in Excel2 minutes read
 QUARTILE.INC function - The function returns the quartile of a dataset including values 0 and 1 in Excel3 minutes read
 LARGE function - The function returns the kth largest value in a dataset in Excel3 minutes read
 KURT function - The function returns the sharp coefficient of a dataset in Excel3 minutes read
 TRIMMEAN function - The function returns the average of the inner part of a dataset in Excel2 minutes read
Reader Comments 0
Sign in with email or Google to join the discussion.