How to use the NORMDIST function in Excel - Function that returns the distribution in Excel
The NORMDIST function returns a distribution with a specified mean and standard deviation. The NORMDIST function has applications in statistics, including hypothesis testing.
Table of Contents
When working with Excel data tables and statistics, knowing and using Excel functions will help you complete your work. And in today's article, Network Administrator will introduce you to the NORMDIST function in Excel and how to use the function.
The NORMDIST function returns the normal distribution in Excel with a specified mean and standard deviation. The function will be applied in statistical tables and hypothesis testing. The following article uses the NORMDIST function for Excel versions 2003 to Excel 2013.
Using the NORMDIST function in Excel
We have the syntax to use the NORMDIST function:
NORMDIST(x, mean, standard_dev, cumalative)
In there :
- x: is the value for which you want to calculate the distribution. Required parameter
- mean: The arithmetic mean of the distribution. Required parameter.
- standard_dev: Standard deviation of the distribution. Required parameter.
- cumalative: A logical value that specifies the form of the function. Required parameter.
- cumalative=true: Returns the result of the cumulative distribution function
- cumalative=false: Returns the result of the probability density function.
Note:
- If the mean or standard deviation is not a number => the function returns the #VALUE! error.
- If mean = 0 and standard deviation = 1, cumulative = True => the function returns the normal distribution NORMSDIST.
- If the standard deviation is less than 0 => The function returns the value #NUM!.
- When cumulative value = TRUE => distribution applies from negative infinity to x value.
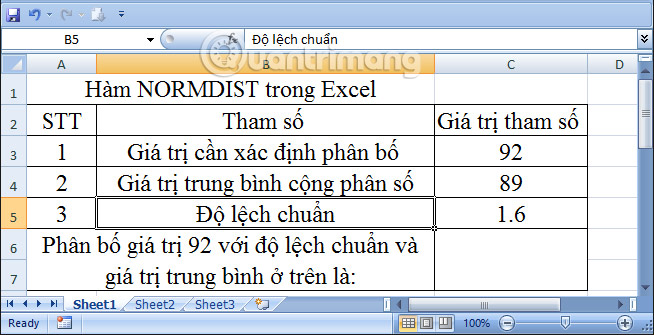
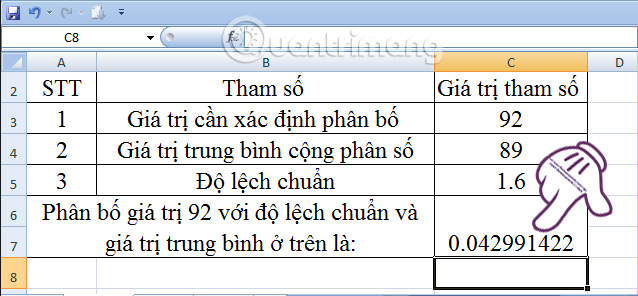
We have an example of calculating the distribution of the value 92 according to the table below.
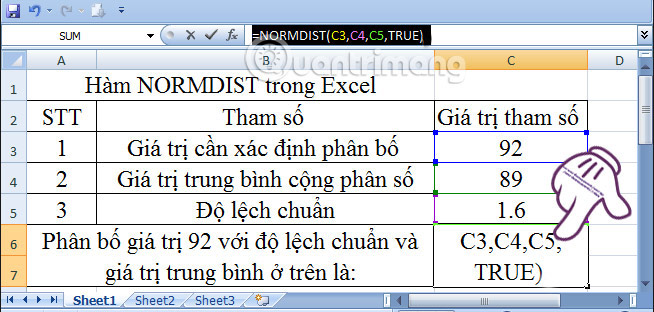
Case 1: Cumalative has TRUE value (Cumalative=true)
Step 1:
In the cell to be calculated, we enter the formula: =NORMDIST(C3,C4,C5,TRUE) .
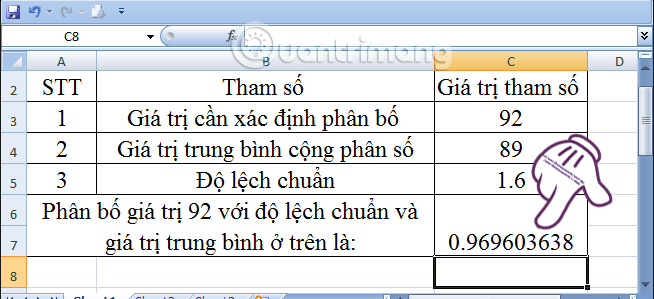
Step 2:
After entering the formula, press Enter and get the result as shown below.
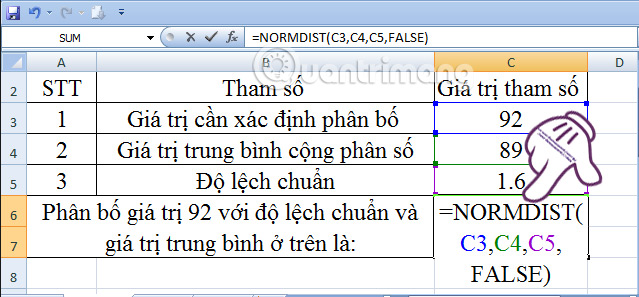
Case 2: Cumalative value = FALSE (Cumalative=false)
Step 1:
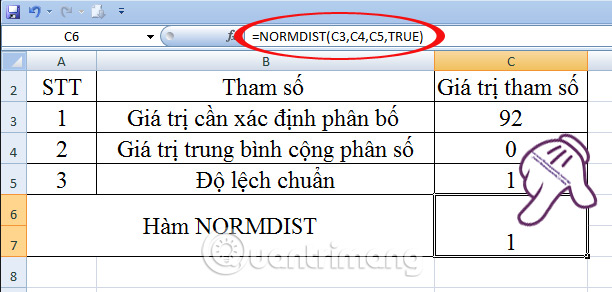
We enter the formula as follows: =NORMDIST(C3,C4,C5,FALSE) .
Step 2:
You also press Enter and get the result as shown below:
Case 3: If standard deviation = 1 and mean = 0, cumulative = True > NORMDIST(92)= NORMSDIST(92)
NORMDIST function value (92):
Readers enter the formula: =NORMDIST(C3,C4,C5,TRUE) . And the result will be as below.
NORMSDIST(92) function value:
We enter the formula: =NORMSDIST(C3) and the result is as below.
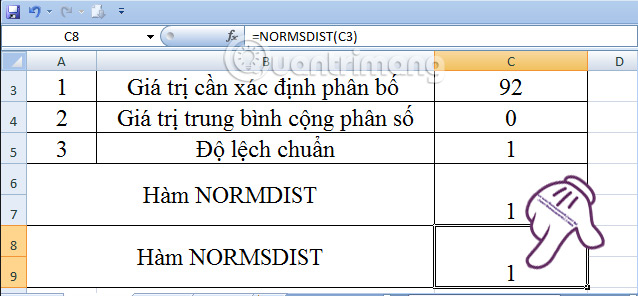
So, if standard deviation = 1 mean = 0 and cumulative = true => NORMSDIST function equals NORMDIST function value.
Above is a tutorial on using the NORMDIST function in Excel to calculate the normal distribution with standard deviation and special cases between the NORMSDIST function and the NORMDIST function.
See also the following articles:
Was this article helpful?
Your feedback helps us improve.
Related Articles
 How to use NORMDIST function in Excel3 minutes read
 NORMDIST function - The function returns the normal distribution with the standard deviation and the average value specified in Excel3 minutes read
 WEIBULL function - The function returns the Weibull distribution in Excel3 minutes read
 GAMMA.INV function - The function returns the inverse of the gamma distribution in Excel2 minutes read
 GAMMA.DIST function - The function returns the gamma distribution in Excel3 minutes read
 CHIDIST function - Function returns the right end probability of the distribution when squared in Excel2 minutes read
Reader Comments 0
Sign in with email or Google to join the discussion.