KURT function - The function returns the sharp coefficient of a dataset in Excel
Description: The function returns the sharp coefficient of the dataset. Kurtosis indicates the sharp or flat characteristics of a dataset. - If the coefficient is positive - the distribution is relatively pointed. - If the negative coefficient is negative - the distribution is relatively flat. Syntax: KURT (number1, [number2], ...).
The following article introduces you to the KURT function - one of the functions in the statistical function group is very popular in Excel.

Description: The function returns the sharp coefficient of the dataset. Kurtosis indicates the sharp or flat characteristics of a dataset.
- If the positive sharp coefficient -> is relatively pointed distribution.
- If the negative coefficient is negative -> the distribution is relatively flat.
Syntax: KURT (number1, [number2], .)
Inside:
- number1, [number2], .) : Arguments that you want to calculate the coefficient of sharpness, where number1 is the required value, the remaining arguments are optional and contain up to 255 number arguments .
Attention:
- The value of the argument must be a number, name, array or reference containing numbers.
- Logical or text values when typing directly into the argument list -> these values are still counted.
- If the argument is a reference array containing text values or logic -> these values are ignored, but the value 0 is still counted.
- Arguments that are text or error values cannot be converted -> cause errors in the function.
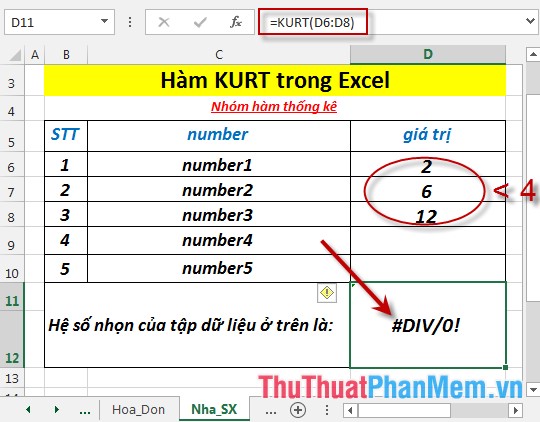
- If the number of data points is less than 4 or the standard deviation is 0 -> the function returns the # DIV / 0 error value
- The kurtosis is determined by the formula:
[left {{frac {{nleft ({n + 1} right)}} {{left ({n - 1} right) left ({n - 2} right) left ({n - 3} right)}} sum {{{left ({frac {{{x_i} - bar x}} {s}} right)} ^ 4}}} right} - frac {{3 {{left ({n - 1} right)} ^ 2 }}} {{left ({n - 2} right) left ({n - 3} right)}}]
Where: s is the sample standard deviation.
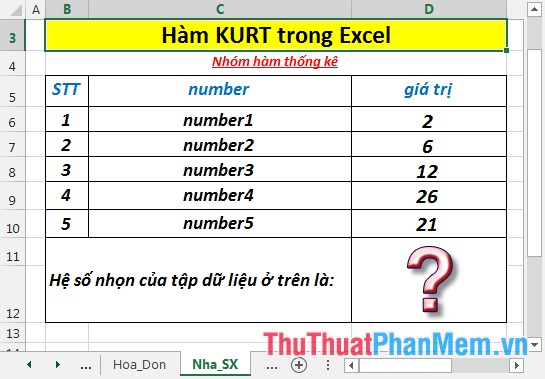
For example:
Find the sharp coefficient of the data set in the data table below:
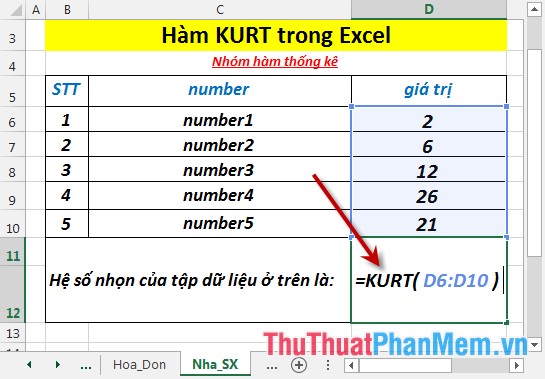
- In the cell to calculate enter the formula : = KURT (D6: D10)
- Press Enter -> the sharp coefficient of the dataset is:
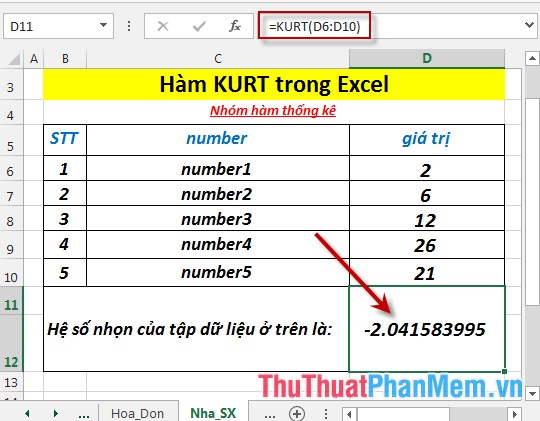
The kurtosis of the above data set is less than 0 -> this data set is distributed flat.
- Where the number of data points of 2 different x and y arrays is logical or text values -> the function ignores these values.

- If the score of the dataset is less than 4 -> the function returns the # DIV / 0 error value
Above are instructions and some specific examples when using the KURT function in Excel.
Good luck!