Instructions on how to create diagonal lines in Excel box
Manipulating 1 cell into 2 diagonal triangles with a line on Excel is a very basic operation and is often performed during the process of creating tables on Excel.
Table of Contents
In order to be able to create tables for calculating and analyzing data, Excel tools will always be first thought of by users. And in the process of creating tables, there will be simple basic operations, such as creating a diagonal to divide an Excel cell into two diagonal triangles. For the types of tables that need to be separated clearly according to the content in each different item, but want to save space, it is necessary to divide a cell into 2 small triangle cells.
In the following article, we will show you how to create a diagonal line in an Excel cell, to create two small triangular cells in a cell.
How to create a diagonal cell in Excel
Step 1:
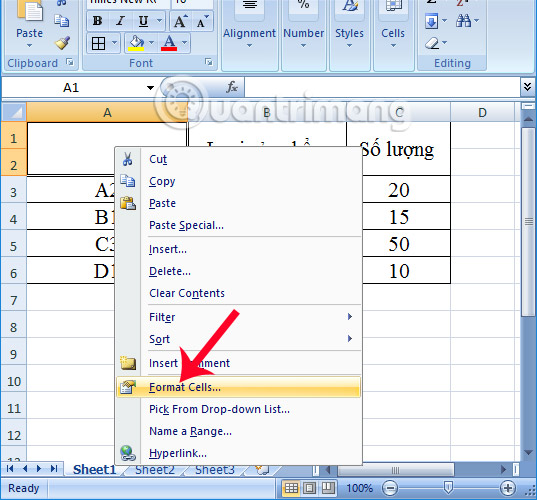
First of all, we have the following data table as an example. Here, I will perform the operation of dividing the first cell in the table into 2 small cells with a clear cross section of the Area and Category. The Zone column will include all the locations below. The Category column includes Product Type and Quantity.
In the cell to be divided, the user right-click and select Format Cells . to proceed to set all the properties that affect this cell in the data table.
Step 2:
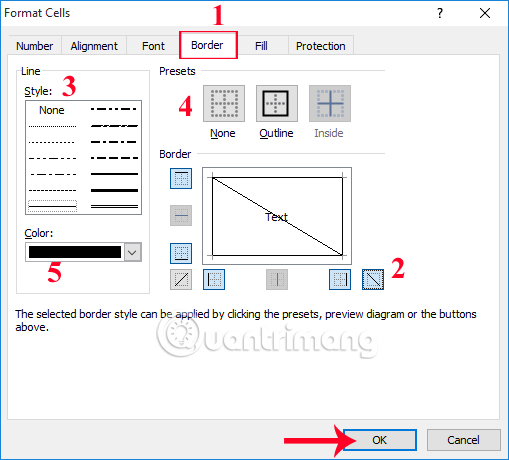
The Interface Cells dialog box appears. Here, we click on the Border tab . Because the requirement here is to divide 1 Excel cell into 2 diagonal triangles, create an Excel diagonal so we follow the following actions:
- 1: Border tab to create a border for tables.
- 2: Create Excel diagonal in 2 different directions left and right.
When pressing once to create a diagonal, press twice to cancel the diagonal. - 3: Select the diagonal type for the cell including the bold, light styles or select the cut lines.
- 4: Option to add frame frame inside or out.
- 5: Choose a color for the border.
Finally click OK to save the changes.
Soon, you will have a table with a cell that has a line.
Step 3:
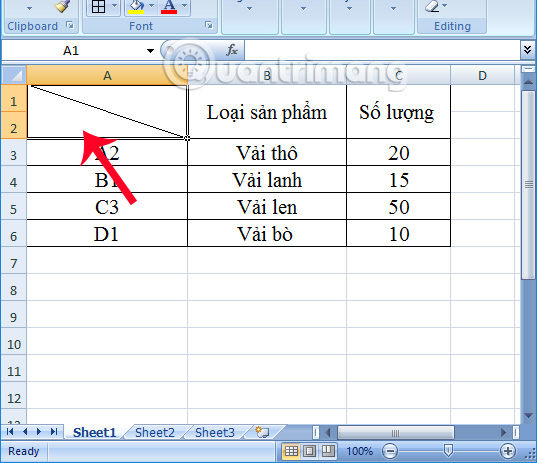
Finally, we just need to enter the text for each created cell . Press the Space key to align text, depending on the length of the text in each cell. Press Alt + Enter to enter the new line in that cell.

The final result will be the data table with the first cell forming two small triangle cells with diagonal lines as shown.

Creating a cell into two triangular cells in Excel with a diagonal line will make the table more clear, flexible and accurate in presenting the content and data. Depending on the content of the table, users can customize the text content accordingly.
Video tutorial to create diagonal lines in Excel
Refer to the following articles:
- Summary of expensive shortcuts in Microsoft Excel
- Instructions for printing two-sided paper in Word, PDF, Excel
- These are the most basic functions in Excel that you need to understand
Was this article helpful?
Your feedback helps us improve.
Related Articles
 Diagonal lines in a cell in Excel2 minutes read
 How to create a diagonal line in a table cell in Word?2 minutes read
 Write italic, vertical, and diagonal lines in Excel2 minutes read
 How to create diagonal lines in Word tables?5 minutes read
 Instructions for adding alternate blank lines on Microsoft Excel4 minutes read
 Excel with hidden lines - How to hide lines and display hidden lines in Excel3 minutes read
Reader Comments 0
Sign in with email or Google to join the discussion.