How to use Excel for financial analysis
Excel is a great tool for users to better understand the status of their business. Here's how to use Microsoft Excel to perform some common financial analysis..

Set up an Excel spreadsheet
We'll start by setting up a sample data set from a hypothetical company. You can copy this dataset to follow along and better understand financial analysis using Excel.
Suppose you want to analyze the financials of a small company like XYZ. You have financial data for 2021 and 2022 as a basis for analysis. Once you have a good grasp of the concepts, you can repeat the examples using real data.
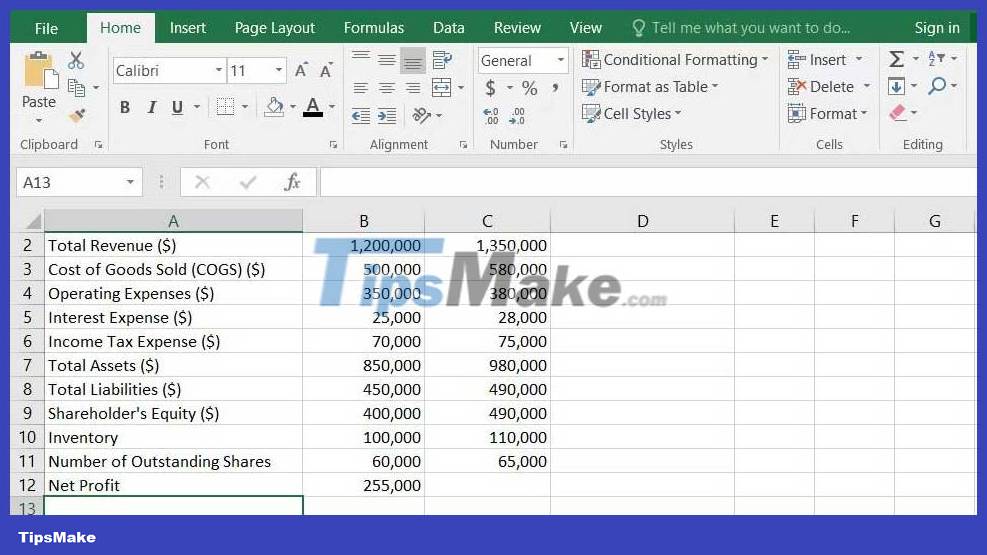
A sample data table would look like this:
Popular financial analysis formula
Excel provides a variety of formulas that can help you perform financial analysis, including any basic mathematical calculations involving ratios and percentages.
Below are some commonly used financial formulas that you can use to perform a financial analysis in Excel.
Calculate revenue and sales indicators
Here's the formula you can use to calculate your data set's revenue and profit margin:
- Sales revenue: This is the total income or revenue generated from selling your products and services. The total revenue in your data set represents sales revenue. In the example above, sales revenue in 2021 is $1,200,000.
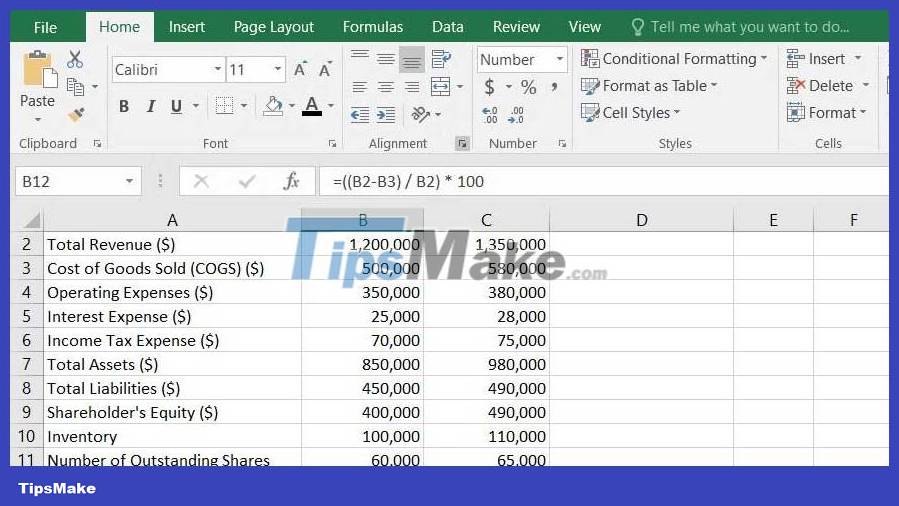
- Gross profit margin: This is the remaining revenue after deducting the cost of goods sold. To calculate this, follow this formula:
Tỷ suất lợi nhuận gộp = ((Doanh thu bán hàng - COGS) / Doanh thu bán hàng) * 100Applied to the sample data, the formula in cell B12 would look like this:
=((B2-B3)/B2)*100.
Line income margin: The revenue remaining after deducting all expenses (e.g., operating expenses and taxes) is the net profit margin of any company. To calculate net profit margin, you can use the following formula.
Biên thu nhập dòng = (Thu nhập dòng / Doanh thu bán hàng) * 100Use this formula in the sample data table as follows:

Evaluate liquidity
A company's liquidity ratio represents its ability to meet short-term financial obligations. This information is often used to determine whether a company has enough current assets to cover its current liabilities.
Here are some common liquidity ratio formulas used to perform financial analysis in Excel:
Current ratio : This ratio formula helps evaluate a company's financial stability by calculating its short-term liquidity. You can use this formula:
Chỉ số thanh toán hiện hành = Tài sản hiện tại / Nợ ngắn hạnIn the sample data table, we will divide the values in B7 and B8 to calculate the result.
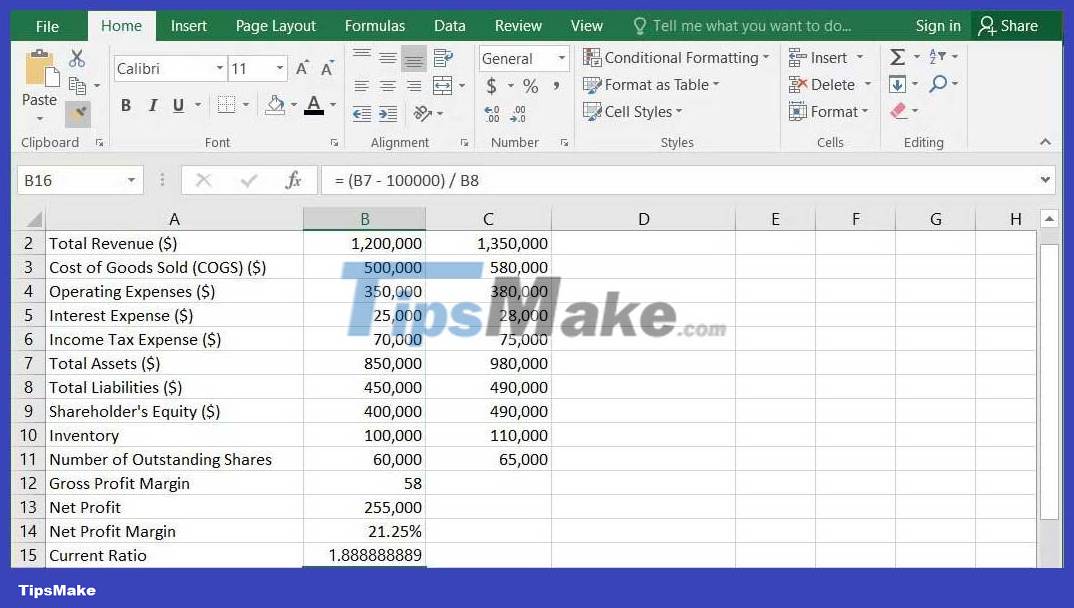
Quick ratio : In case, you want to exclude inventory from current assets (as converting it into cash in the short term may be difficult), you can use the ratio formula Fast payment, that is:
Hệ số thanh toán nhanh = (Tài sản lưu động - Hàng tồn kho) / Nợ ngắn hạnThe article uses this formula to calculate the quick ratio:
=(B7-B10)/B8
Measure profitability
Return on investment is a valuable tool for measuring how well your company can generate income from expenses and investments. You can use them to see how efficiently your company uses resources.
Return on assets (ROA): This is your company's ability to generate profits from its assets. The formula you can use to calculate this is:
ROA = (Thu nhập ròng / Tổng tài sản) * 100As calculated earlier, the net income and total assets of the data set are 255,000 USD and 850,000 USD. Therefore, the article will use this formula to calculate ROA:
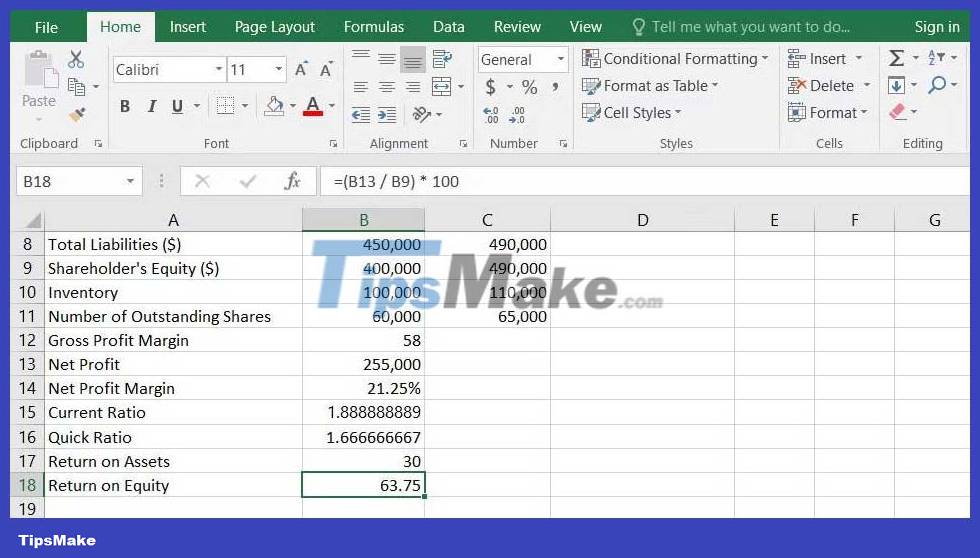
=(B13/B7)*100Net return on equity ratio: As the name suggests, this ratio represents how well your company uses shareholder equity to generate earnings. To calculate this, use the formula:
ROE = (Thu nhập ròng / Vốn cổ đông) * 100To calculate this metric for sample data, use "(B13 / B9) * 100" in an Excel table, as shown below:
Above are some ways to use Excel for financial analysis . Hope the article is useful to you.