Data Analysis in Excel
Data Analysis is Excel's statistical tool, but it is not available in Menu interface. In this article, Dexterity Software will guide you how to turn on the Data Analysis tool and use it.
Table of Contents
Data Analysis is Excel's statistical tool, but it is not available in Menu interface. In this article, Dexterity Software will guide you how to turn on the Data Analysis tool and use it.
How to turn on the Data Analysis tool
Step 1 : Select File (1) => select Options (2) .

Step 2: Options window appears, go to Add-in (1) , select Analysis ToolPak (2) and then click Go (3) .

Step 3: The Add-ins interface appears, select the Analysis ToolPak item (1) and click the OK button (2) .

The results of the Data Analysis tool appear in the Data section of the Ribbon.

How to use the Data Analysis tool in Excel
Data Analysis is a tool used to analyze data in Excel. So you consider the following example to see the use of Data Analysis offline.
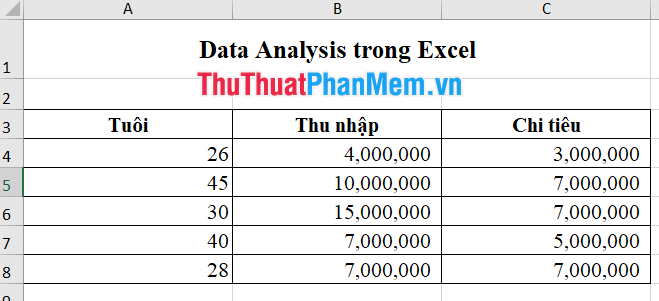
Suppose you have a table of income and expenditure statistics of 5 subjects as follows:
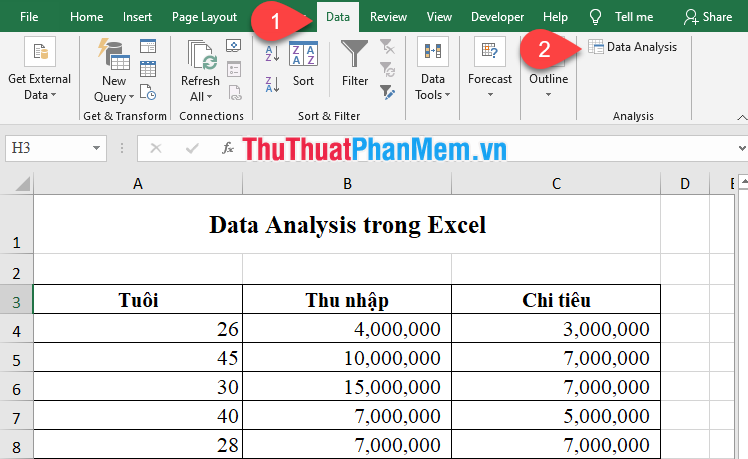
Step 1: On the Data tab (1) , Click the Data Analysis icon (2) .
Step 2: In the Data analysis window , select Regression and then OK .

Step 3: The Regression window appears.

- Input Y Range: Container of dependent variables (click on the right input box and then go to the main screen, select the dependent variable container - including the variable name)
- Input X Range: Container for independent variables (click on the right input box and then go to the main screen to select the container of independent variables - both name and variable)
- Labels : Click this box to use variable names
- Confidence Level: Confidence (1-a), default 95%, if you want to change then click this box and enter new confidence
- Output Range: Export area, click this option, then click on the input box to the right, then outside the main screen, select any cell as the output location.
With the spreadsheet above, Software Tips selected parameters as follows and then press the OK button .

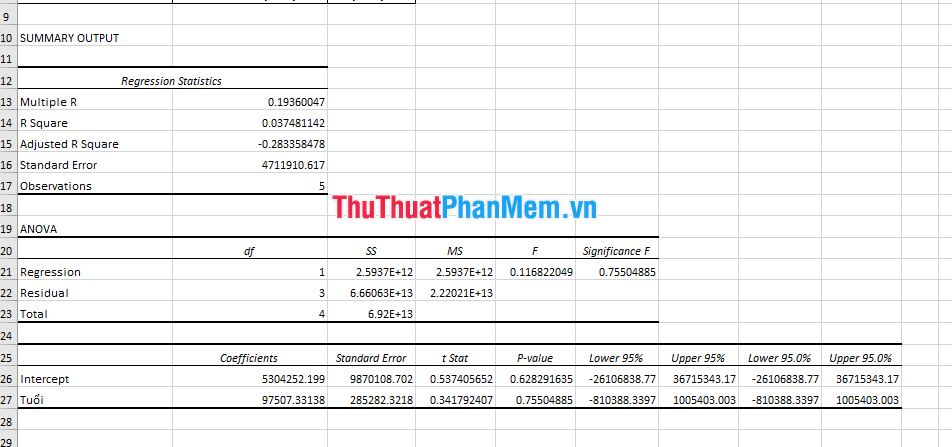
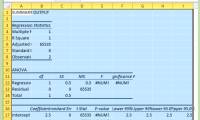
And get the results:
Above Software Tips showed you how to turn on Data Analysis tool and how to use this tool. Good luck!
Was this article helpful?
Your feedback helps us improve.
Related Articles
 ChatGPT and its Excel file analysis capabilities.8 minutes read
 Summary of 50 Excel shortcuts you should know by 20238 minutes read
 How to use Quick Analysis in Excel5 minutes read
 What is data analysis?3 minutes read
 How to Run Regression Analysis in Microsoft Excel4 minutes read
 Excel 2019 (Part 28): What-if Analysis7 minutes read
Reader Comments 0
Sign in with email or Google to join the discussion.