How to Run Regression Analysis in Microsoft Excel
Regression analysis can be very helpful for analyzing large amounts of data and making forecasts and predictions. To run regression analysis in Microsoft Excel, follow these instructions. If your version of Excel displays the ribbon (Home,....
Method 1 of 2:
Make Sure Regression Analysis Is Supported On Your Excel
-
 If your version of Excel displays the ribbon (Home, Insert, Page Layout, Formulas…)
- Click on the Office Button at the top left of the page and go to Excel Options.
- Click on Add-Ins on the left side of the page.
- Find Analysis tool pack. If it's on your list of active add-ins, you're set.
- If it's on your list of inactive add-ins, look at the bottom of the window for the drop-down list next to Manage, make sure Excel Add-Ins is selected, and hit Go. In the next window that pops up, make sure Analysis tool pack is checked and hit OK to activate. Allow it to install if necessary.
-
 If your version of Excel displays the traditional toolbar (File, Edit, View, Insert…)
- Go to Tools > Add-Ins.
- Find Analysis tool pack. (If you don't see it, look for it using the Browse function.)
- If it's in the Add-Ins Available box, make sure Analysis tool pack is checked and hit OK to activate. Allow it to install if necessary.
-
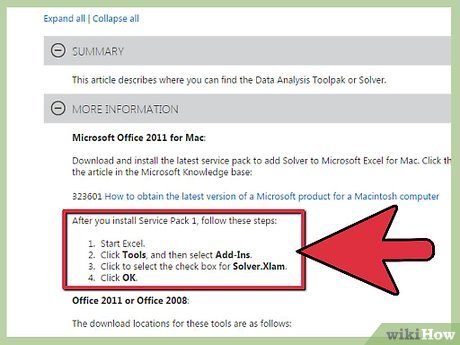 Excel for Mac 2011 and higher do not include the analysis tool pack. You can't do it without a different piece of software. This was by design since Microsoft does not like Apple.
Method 2 of 2:
Run Regression Analysis
-
 Enter the data into the spreadsheet that you are evaluating. You should have at least two columns of numbers that will be representing your Input Y Range and your Input X Range. Input Y represents the dependent variable while Input X is your independent variable.
 -
 Open the Regression Analysis tool.
- If your version of Excel displays the ribbon, go to Data, find the Analysis section, hit Data Analysis, and choose Regression from the list of tools.
- If your version of Excel displays the traditional toolbar, go to Tools > Data Analysis and choose Regression from the list of tools.
-
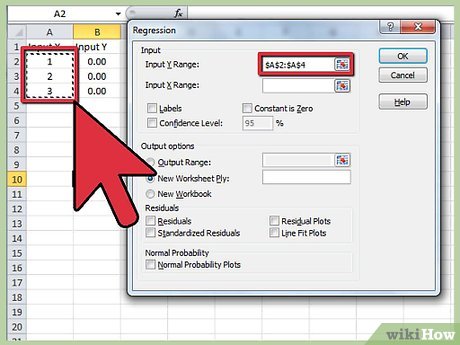 Define your Input Y Range. In the Regression Analysis box, click inside the Input Y Range box. Then, click and drag your cursor in the Input Y Range field to select all the numbers you want to analyze. You will see a formula that has been entered into the Input Y Range spot.
 -
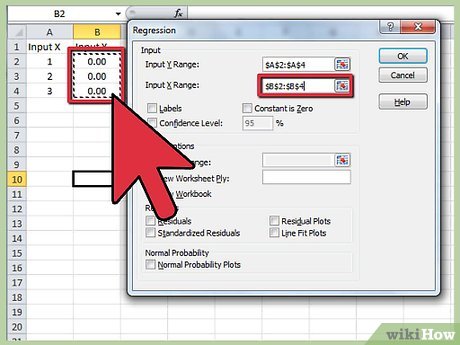 Repeat the previous step for the Input X Range.
 -
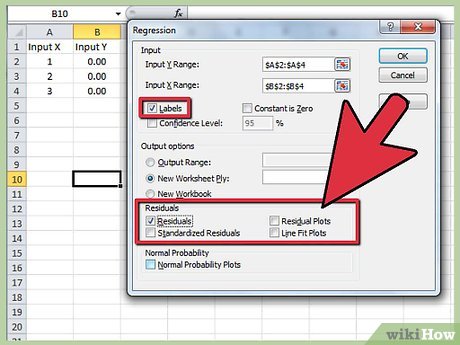 Modify your settings if desired. Choose whether or not to display labels, residuals, residual plots, etc. by checking the desired boxes.
 -
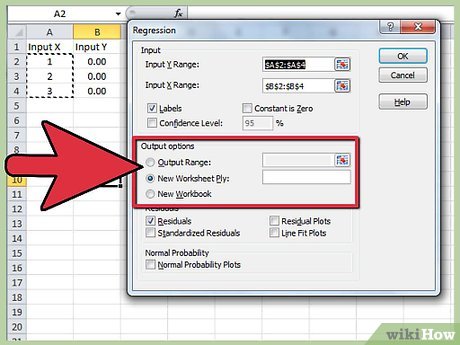 Designate where the output will appear. You can either select a particular output range or send the data to a new workbook or worksheet.
 -
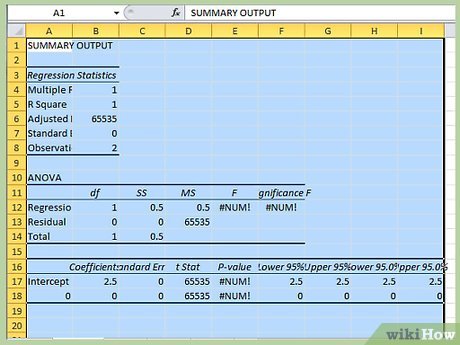 Click OK. The summary of your regression output will appear where designated.
Sample Regression Analyses
 Sample Regression Analysis
 Sample Regression Analysis for House Size
 Sample Regression Analysis for Blood Pressure