4 Advanced PivotTable Functions for Excel Data Analysis
Data analysis is not easy. So, to enhance your data, you can use a range of advanced PivotTable functions in Excel..
You should not underestimate pivot tables in Excel. That's because Excel's PivotTables provide everything you need to analyze your data. From condensing rows of data to summing and grouping similar columns, pivot tables have it all.
However, data analysis is not simple. So, to enhance your data, you can use a range of advanced PivotTable functions in Excel.
If you are familiar with PivotTables and are looking to go further with some advanced functions, you can check out the following advanced PivotTable functions.
Prepare data set
To understand advanced functions, you must first prepare the initial data set. For convenience, use the following rows and columns to illustrate advanced PivotTable functions.
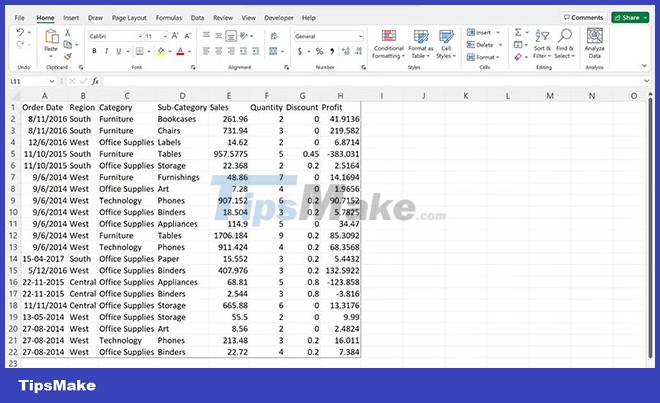
You can download this data directly from the source to practice the functions listed below.
How to create a pivot table in Excel
Select the data for your Excel PivotTable. To insert a pivot table, click the Insert tab at the top, followed by the PivotTable option.
Select the From Table/Range option .
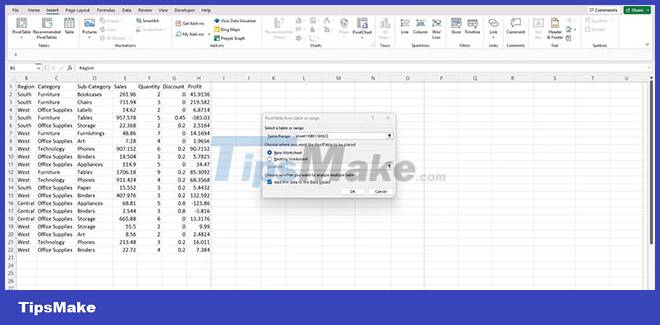
Because you selected the data range before inserting the pivot, the data range is automatically updated in the pivot dialog box. You can choose the destination of the pivot table - place it on an existing sheet or a new sheet.
After clicking Ok , your pivot is ready for review. You can add the required row/column/value views from the field list.
In addition, you can automatically create pivot table in Excel using VBA to save time and effort.
4 Advanced PivotTable Functions for Excel Data Analysis
1. Slicer
Slicer was introduced as part of the Microsoft Excel 2010 suite and is available in higher versions of MS Office. Microsoft continues to release new Excel functions to help users get the most out of their common data tasks.
Like some other Excel functions, even slicers are a great way to control your pivots through an external pivot filter.
Unlike the built-in pivot filter, you can customize the filters and display the content at any time. Users find Slicer quite effective because you can filter multiple items and show them to everyone.
Add slicers in PivotTable
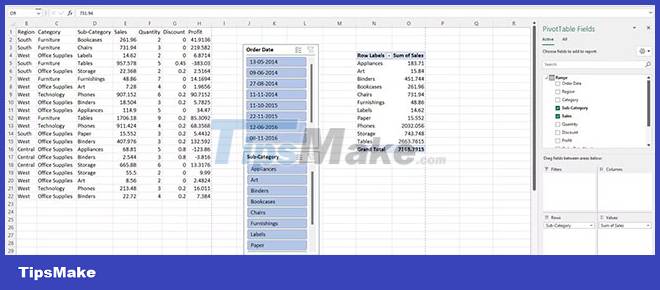
To add slicers to the pivot table, click on the pivot table and navigate to the PivotTable Analyze tab , then the Insert Slicer option.
When you click the Slicer button , you can select one or more columns to use as slicers. All the options you select are displayed in separate filter boxes next to the pivot for convenience. Slicer entries filter the pivot table and display whatever is relevant.
Slicers offer many benefits, especially when you want to control multiple pivot tables simultaneously with slicer (filter) windows.
2. Calculated field
Calculated fields are a great way to add calculations to your pivot table, which is essential when working with multiple numeric columns, to quickly calculate new values.
Instead of struggling with PivotTable options, you can create new column(s) in your pivot table. Whenever you make changes to existing data, the changes are automatically reflected in the pivot table. However, you need to refresh the pivot table first.
How to create a calculated field in a pivot table
Let's say you want to calculate the total sales for each subcategory. The obvious formula is to take the product of the sales and quantity fields.
To perform such calculations efficiently, you can create a calculated field in your pivot table.
To create a calculated field, click on your pivot table and navigate to the PivotTable Analyze tab. Click the Fields, Items, & Sets button .
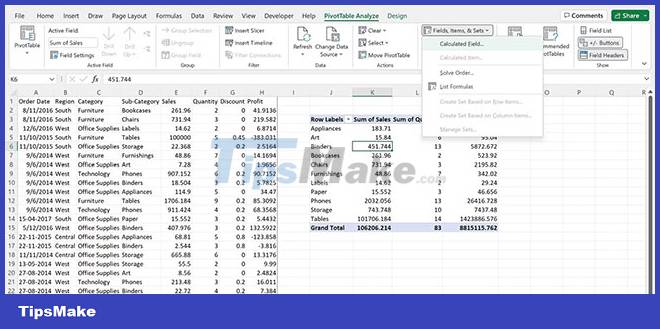
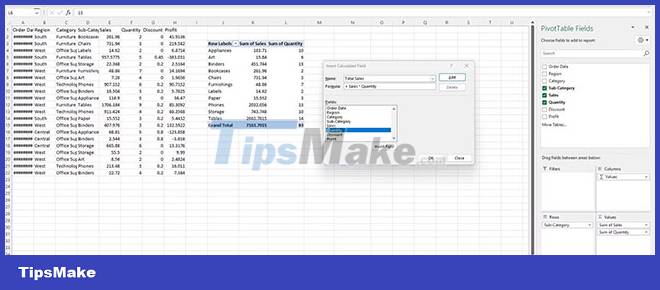
Click Calculated Field from the drop-down menu. In the dialog box, inside the Name column , specify the column header. Next, from the Fields list , select the column name you want to use in the formula.
Find the Sales option . Click the Insert Field button. The Sales option is automatically added to the Formula column. Similarly, you can click Quantity , then the Insert Field button.
Add an asterisk (*) symbol between two field names in the formula bar. Click the Add button.
In the pivot table, the newly created column is available.
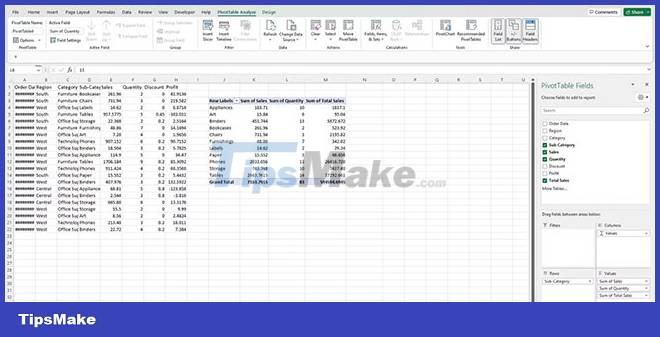
Similarly, you can create multiple calculated fields in your pivot table to enhance your calculation.
3. How to refresh multiple pivot tables
When you deal with complex data, there is a high chance that you will create multiple pivot tables simultaneously.
Depending on your data structure, you may prefer to place several pivots on one worksheet, while many more pivots may be on other worksheets in the same workbook.
There are two ways you can refresh multiple pivot tables in your workbook. The first option is to use Excel VBA to automate the refresh process.
Alternatively, you can also do this manually. Click on any pivot table and navigate to the PivotTable Analyze tab in the top ribbon menu. Click the Refresh button's drop-down menu. Select Refresh All from the list.
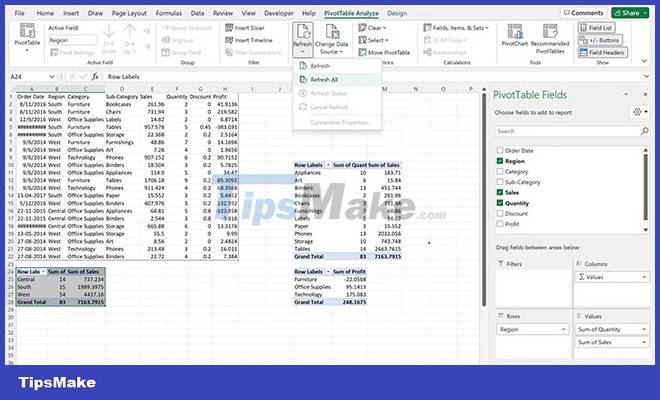
You will notice all the pivot tables appear in the workbook as soon as you click this button. Any new changes will reflect in the pivot table.
4. Group related fields together
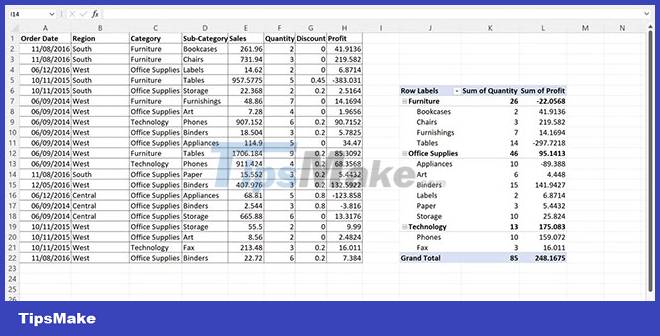
You often want to group specific data points so that end users can better understand the data structure. As an expert, you can clearly understand the data and how it relates to broader categories. In contrast, it can often be difficult for end users to understand these groups in the pivot table.
To make this process easy, you can use the Group function to group subcategories together and rename the group to create meaningful insights.
To create a group, press the Ctrl key and select multiple items from the list of items in one go. Right click in the pivot table and click the Group option.
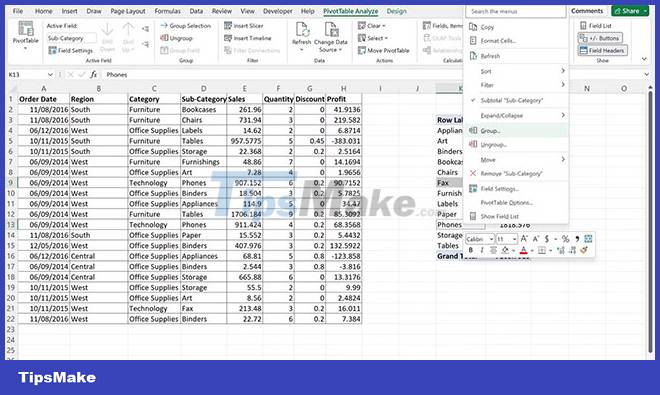
Excel creates default groups, which you can edit by selecting multiple items.
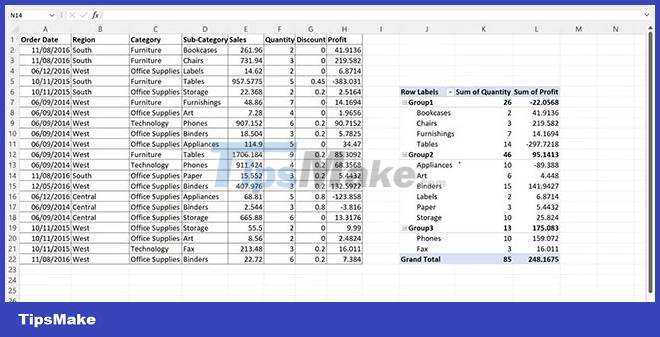
When the groups are ready, you can rename the group according to your needs.
To delete groups, right-click the pivot table and select the Ungroup option.