SLOPE function - The function returns the slope of a linear regression line through data points in Excel
SLOPE function: The function returns the slope of a linear regression line through data points. The slope is the vertical distance divided by the horizontal distance between any two points on that line, the rate of change along the regression line. Syntax: SLOPE (known_ys, known_xs)
The following article introduces you to the SLOPE function - one of the functions in the group of statistical functions that is very popular in Excel.

Description: The function returns the slope of a linear regression line through data points. The slope is the vertical distance divided by the horizontal distance between any two points on that line, the rate of change along the regression line.
Syntax: SLOPE (known_y's, known_x's)
Inside:
- known_y's : An independent data point array or range.
- known_x's: The set of independent data points.
Attention:
- The value of the argument must be a number, name, array or reference containing numbers.
- If known_y's and known_x's are empty or have a different number of data points -> the function returns the # N / A error value .
- If the argument is a reference array containing text values or logic -> these values are ignored, but the value 0 is still counted.
- If argument values use invalid data types -> the function returns the #VALUE! Error value
- The slope equation for the regression line is:
[b = frac {{sum {left ({x - overline x} right) left ({y - overline y} right)}}} {{sum {{{left ({x - overline x} right)} ^ 2 }}}}]
Where x and y are the sample mean AVERAGE (known_x's) and AVERAGE (known_y's)
For example:
Calculate the slope of the linear regression line through data points in the following data table:
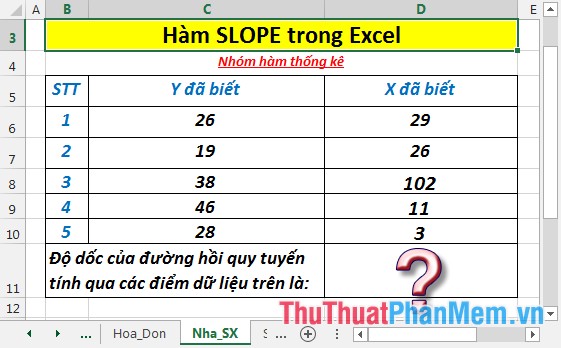
- In the cell to calculate enter the formula : = SLOPE (C6: C10, D6: D10)
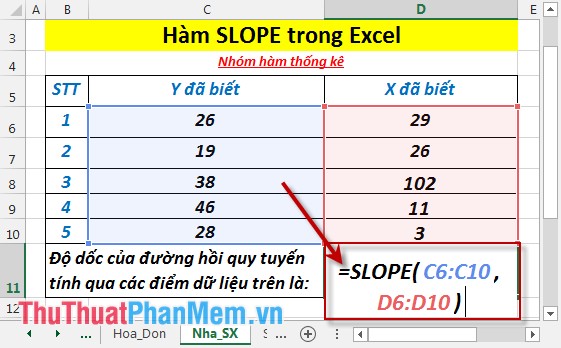
- Press Enter -> slope of the linear regression line through the above data points is:

Above are instructions and some specific examples when using SLOPE function in Excel.
Good luck!
Was this article helpful?
Your feedback helps us improve.
Related Articles
 FORECAST function - The function returns a value along a linear trend in Excel3 minutes read
 Linear graphs in Machine Learning1 minutes read
 Linear Regression in Machine Learning2 minutes read
 TREND - The function returns values in a linear trend in Excel3 minutes read
 STEYX function - The function returns the standard error of the predicted value of y for each value of x in regression in Excel3 minutes read
 COVARIANCE.P function - The function returns the covariance of a set, the product of the average of degrees of instruction for each pair of data points in Excel3 minutes read
Reader Comments 0
Sign in with email or Google to join the discussion.