How to Make Tables Using Microsoft Excel
This wikiHow teaches you how to create a table of information in Microsoft Excel. You can do this on both Windows and Mac versions of Excel. Open your Excel document. Double-click the Excel document, or double-click the Excel icon and then....
Part 1 of 3:
Creating a Table
-
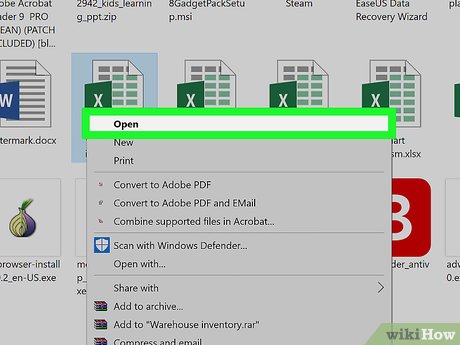 Open your Excel document. Double-click the Excel document, or double-click the Excel icon and then select the document's name from the home page.
- You can also open a new Excel document by clicking Blank Workbook on the Excel home page, but you'll need to input your data before continuing.
-
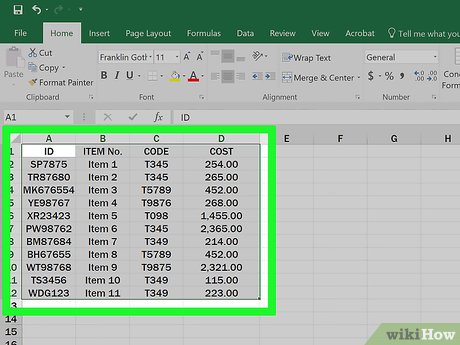 Select your table's data. Click the cell in the top-left corner of the data group you want to include in your table, then hold down ⇧ Shift while clicking the bottom-right cell in the data group.
- For example: if you have data in cells A1 down to A5 and over to D5, you would click A1 and then click D5 while holding ⇧ Shift.
-
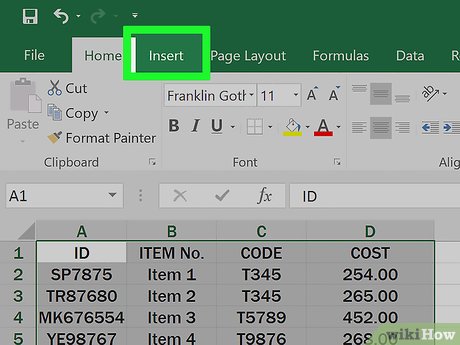 Click the Insert tab. It's a tab in the green ribbon at the top of the Excel window. Doing so will display the Insert toolbar below the green ribbon.
- If you're on a Mac, make sure you don't click the Insert menu item in your Mac's menu bar.
-
 Click Table. This option is in the "Tables" section of the toolbar. Clicking it brings up a pop-up window.
 -
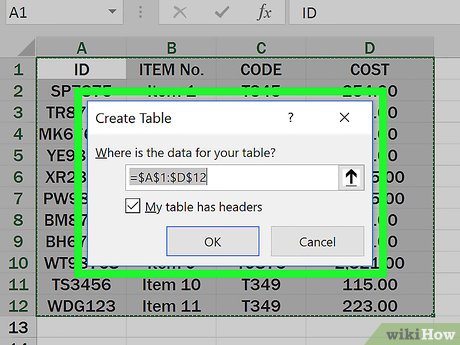 Click OK. It's at the bottom of the pop-up window. Doing so will create your table.
- If your data group has cells at the top of it that are dedicated to column names (e.g., headers), click the "My table has headers" checkbox before you click OK.
Part 2 of 3:
Changing the Table's Design
-
 Click the Design tab. It's in the green ribbon near the top of the Excel window. This will open a toolbar for your table's design directly below the green ribbon.
- If you don't see this tab, click your table to prompt it to appear.
-
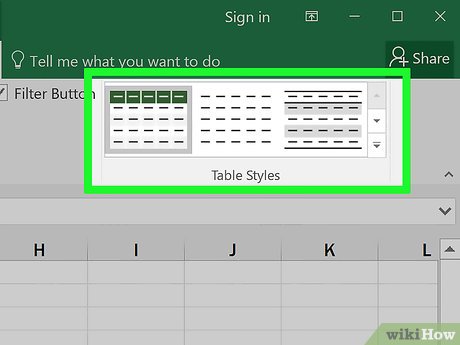 Select a design scheme. Click one of the colored boxes in the "Table Styles" section of the Design toolbar to apply the color and design to your table.
- You can click the downward-facing arrow to the right of the colored boxes to scroll through different design options.
-
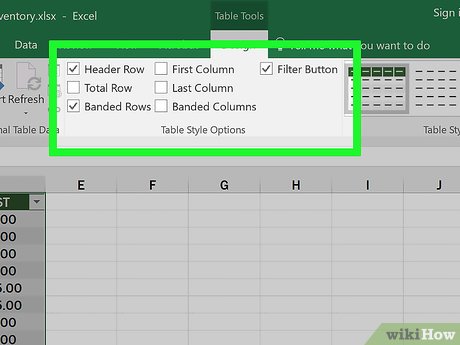 Review the other design options. In the "Table Style Options" section of the toolbar, check or uncheck any of the following boxes:
- Header Row - Checking this box places column names in the top cell of the data group. Uncheck this box to remove headers.
- Total Row - When enabled, this option adds a row at the bottom of the table that displays the total value of the right-most column.
- Banded Rows - Check this box to color in alternating rows, or uncheck it to leave all rows in your table the same color.
- First Column and Last Column - When enabled, these options make the headers and data in the first and/or last columns bold.
- Banded Columns - Check this box to color in alternating columns, or uncheck it to leave all columns in your table the same color.
- Filter Button - When checked, this box places a drop-down box next to each header in your table that allows you to change the data displayed in that column.
-
 Click the Home tab again. This will take you back to the Home toolbar. Your table's changes will remain.
Part 3 of 3:
Filtering Table Data
-
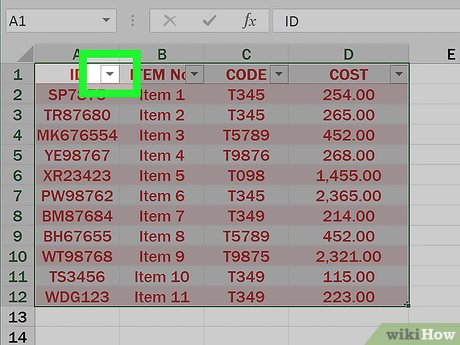 Open the filter menu. Click the drop-down arrow to the right of the header for the column whose data you want to filter. A drop-down menu will appear.
- In order to do this, you must have both the "Header Row" and the "Filter" boxes checked in the "Table Style Options" section of the Design tab.
-
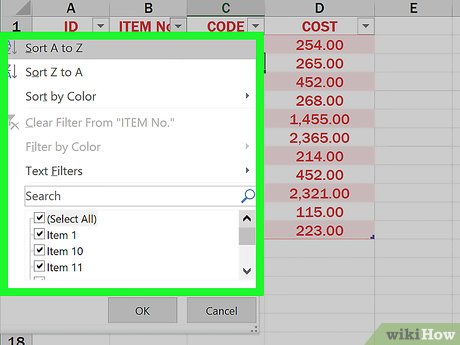 Select a filter. Click one of the following options in the drop-down menu:
- Sort Smallest to Largest
- Sort Largest to Smallest
- You may also have additional options such as Sort by Color or Number Filters depending on your data. If so, you can select one of these options and then click a filter in the pop-out menu.
-
 Click OK if prompted. Depending on the filter you choose, you may also have to select a range or a different type of data before you can continue. Your filter will be applied to your table.