How to create SmartArt graphics in Excel
Creating a chart in Word or Excel is one of the ways to interpret the content to be presented, the reader still understands the content, but you do not need to present more. SmartArt graphics are one of the chart types that are also commonly used on office documents.
SmartArt provides ready-to-use graphic styles for you to use, depending on the content to be presented. Instead of manually charting, we can immediately use the graphics in the list of SmartArt. The following article will guide you how to create a SmartArt chart in Excel.
- Full Word tutorial 2016 (Part 26): Create SmartArt graphics
- How to create charts, graphs in Excel
- 8 types of Excel charts and when you should use them
How to insert SmartArt chart in Excel
Step 1:
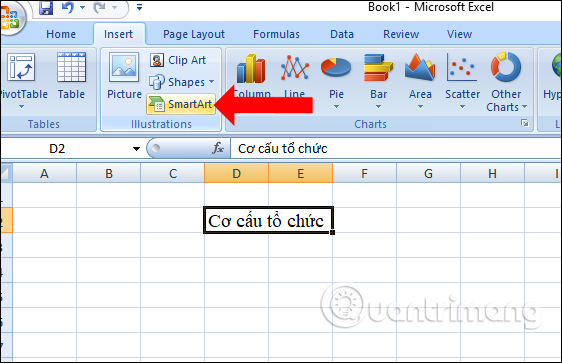
We click on the Insert tab above and then select next illustrations and select SmartArt .
Step 2:
The Choose a SmartArt Graphic dialog box appears with different graphic styles. Based on the content you need to present in Excel, choose the type of graphics to use.
Click on the graphic to use and click OK to use.

Step 3:
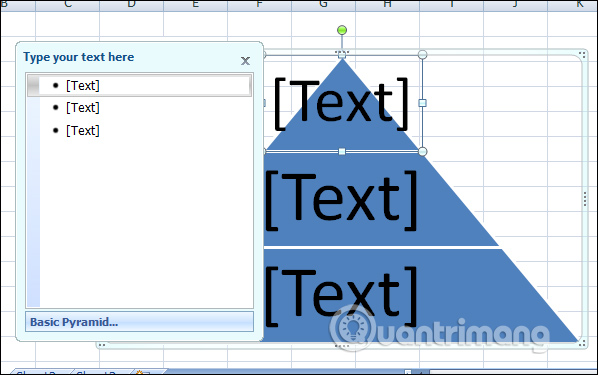
The chart model will appear in the interface on Excel. Please enter the content to display in the Text section.
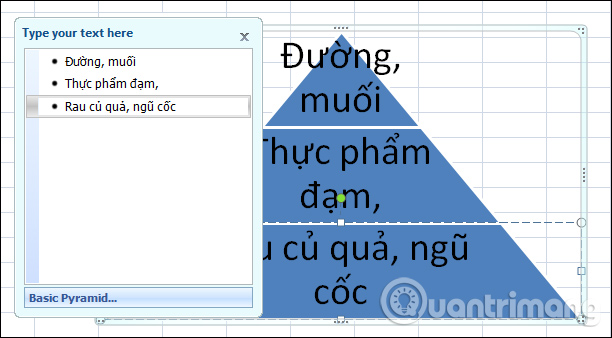
We will have the content inserted into the graphic as shown.
Step 4:
To edit the text content in graphics, just highlight the text and appear a small dialog to change the font, font color and font size.
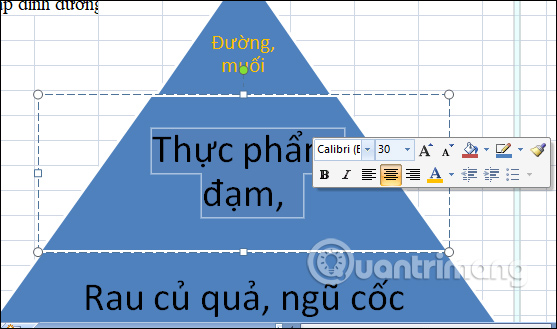
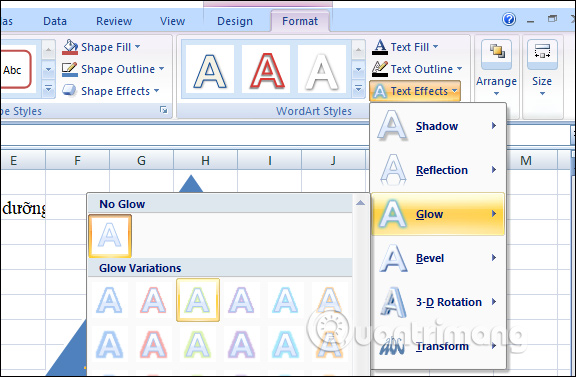
Next, want to edit more than the text in the graphic, click on Format and click on the icon A Take Effects to select the effects for the text.
Step 5:
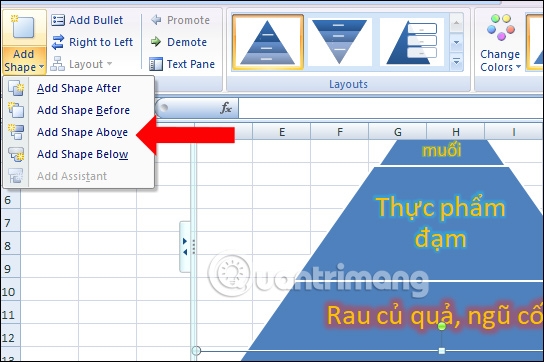
If you want to add other content to the graphic, click on the location to insert it at the Design tab , click on Add Shape . We will have location options to insert graphics.
Step 6:
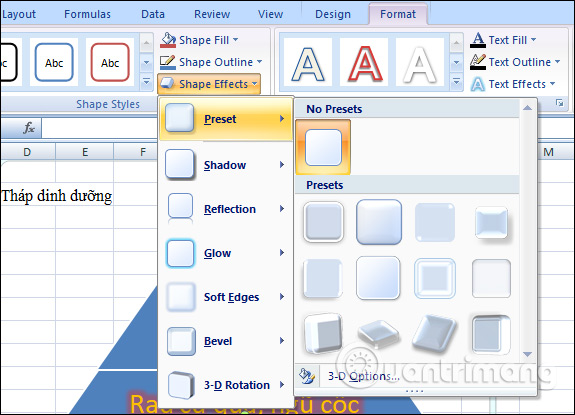
To edit the display frame of the graphic, click on Shape Effects and choose a format such as frame color, border and frame effects.
Step 7:
In the field when entering the content and conducting editing, if the graphic is not suitable, it can be changed to other graphics, the content in the graphic will remain the same. Click Design and in the Layout section click More Layouts to add another type of graphic.
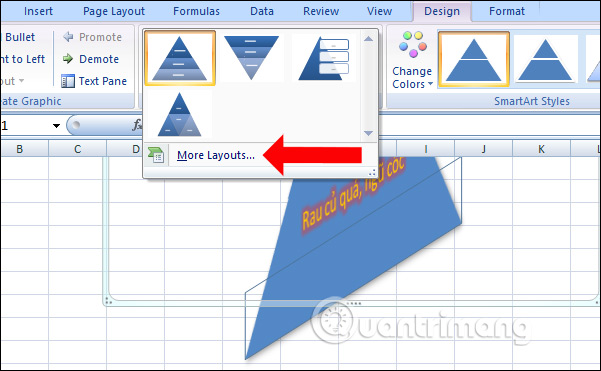
Also in the Change Colors section you can change the colors for graphics if you want.
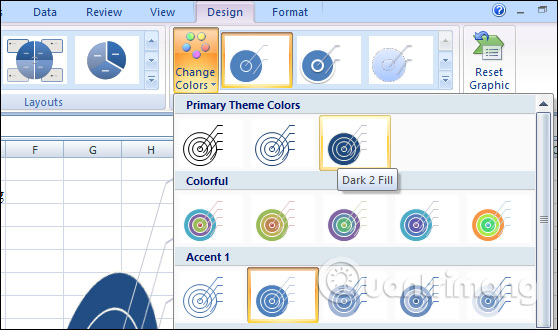
In general, how to create SmartArt graphics in Excel is similar to when we insert SmartArt on Word. Users still have options for creating graphics and editing for created graphics.
See more:
- How to use AVERAGEIF function in Excel
- How to create AutoFill strings in Excel
- How to use the Round function in Excel
I wish you all success!