HARMEAN function - The function returns the harmonic average of a data set in Excel
HARMEAN function: The function returns the harmonic mean of a dataset, the harmonic mean is the reciprocal of the arithmetic mean of the reciprocals. Syntax: HARMEAN (number1, [number2], ...)
The following article introduces you to HARMEAN function - one of the functions in the statistical function group is very popular in Excel.

Description: The function returns the harmonic mean of a dataset, the harmonic mean is the reciprocal of the arithmetic mean of the reciprocals.
Syntax: HARMEAN (number1, [number2], .)
Inside:
- number1, [number2], .) : The values you want to calculate the harmonic mean value, where number1 is the required parameter, the remaining values are optional and contain up to 255 number parameters .
Attention:
- Note: harmonic average
- Arguments can be numbers, names or arrays that contain numbers.
- When typing logical values or textual numbers directly -> these values are still counted.
- If the reference argument or array contains logical values or text -> these values are ignored, but a value of 0 is still counted.
- The value of the argument is a text or an error value that cannot be converted. The function will report an error.
- If any data point ≤ 0 -> the function returns the #NUM! Error value
- The average harmonic equation is:
[frac {1} {{{H_y}}} = frac {1} {n} sum {frac {1} {{{Y_i}}}}]]
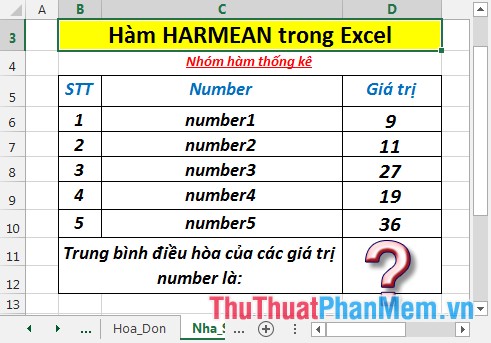
For example:
Calculate the harmonic mean of number values in the following data table:
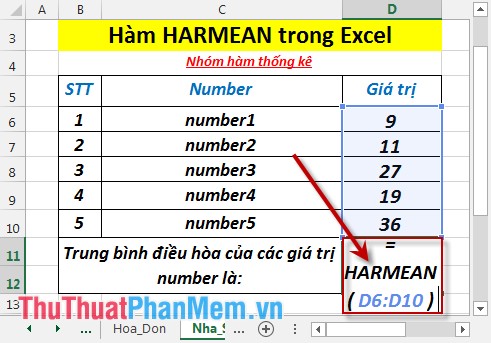
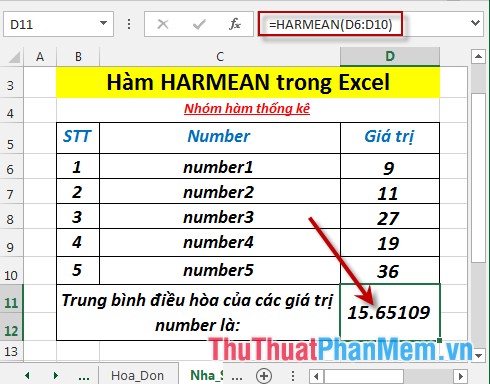
- In the cell to calculate enter the formula : = HARMEAN (D6: D10)
- Press Enter -> harmonic average of number values is:
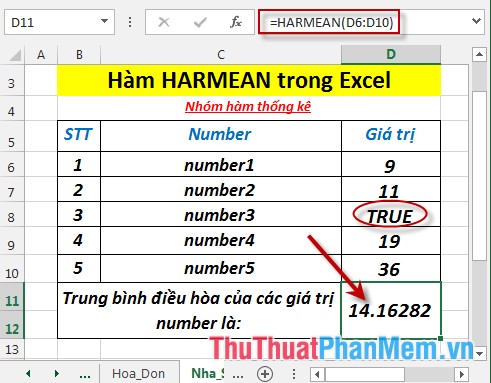
- Where number values are logical or text values -> they are ignored:
Above are instructions and some specific examples when using HARMEAN function in Excel.
Good luck!
Was this article helpful?
Your feedback helps us improve.
Related Articles
 GEOMEAN function - The function returns the average of a positive array or range of data in Excel2 minutes read
 TRIMMEAN function - The function returns the average of the inner part of a dataset in Excel2 minutes read
 AVEDEV function - The function returns the average absolute deviation of data points from their midpoint in Excel2 minutes read
 AVERAGE function - The function returns the average of the arguments in Excel3 minutes read
 How to use the DAVERAGE function in Excel3 minutes read
 COVARIANCE.P function - The function returns the covariance of a set, the product of the average of degrees of instruction for each pair of data points in Excel3 minutes read
Reader Comments 0
Sign in with email or Google to join the discussion.