LOGNORM.DIST - Function returns the logarithmic distribution of x in Excel
LOGNORM.DIST: The function returns the logarithmic distribution of x. Where LN (x) is usually distributed with parameter mean and standard deviation. Support functions from Excel 2010 onwards. Syntax: LOGNORM.DIST (x, mean, standard_dev, cumulative)
The following article introduces you to the LOGNORM.DIST function - one of the functions in the statistical group is very popular in Excel.

Description: The function returns the logarithmic distribution of x. Where LN (x) is usually distributed with parameter mean and standard deviation. Support functions from Excel 2010 onwards.
Syntax: LOGNORM.DIST (x, mean, standard_dev, cumulative)
Inside:
- x : Value to evaluate the function, is a required parameter.
- mean: The average value of LN (x) , is a required parameter.
- standard_dev: Standard deviation of LN (x), is a required parameter.
- cumulative: A logical value that determines the form of the function, which is a required parameter, including:
+ cumulative = True -> returns the cumulative distribution function.
+ cumulative = False -> returns the probability density function.
Attention:
- Any argument except ( cumulative) is not a number -> function returns the #VALUE! Error value
- If x ≤ 0 or standard_dev ≤ 0 -> the function returns the #NUM! Error value
- The cumulative standard logarithmic distribution equation is:
LOGNORM.DIST (x, µ, o) = NORM.S.DIST (1n (x) -µ / o)
For example:
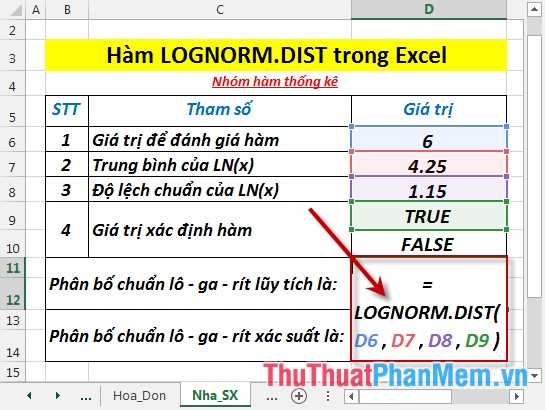
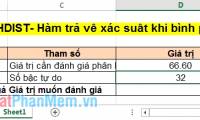
Find the cumulative standard probability and logarithmic distribution as described in the data table below:

1. Calculate cumulative standard logarithmic distribution.
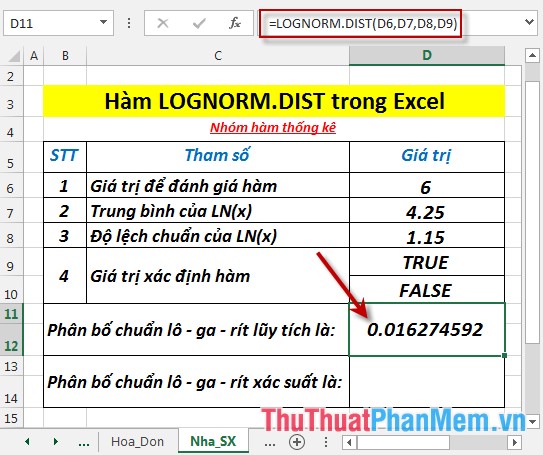
- In the cell to calculate enter the formula : = LOGNORM.DIST (D6, D7, D8, D9)
- Press Enter -> cumulative standard logarithmic distribution is:
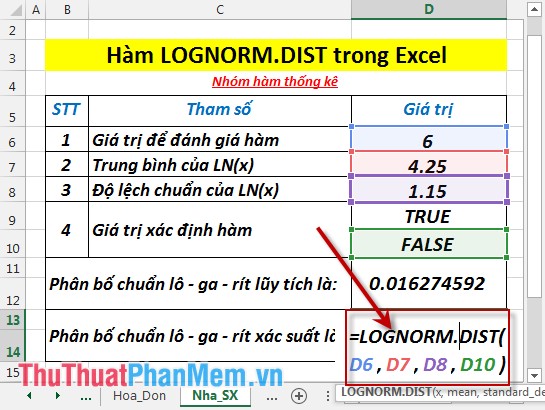
2. Calculate probability distribution logarithm.
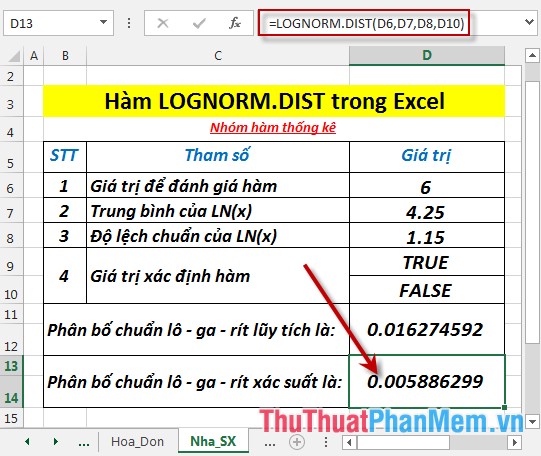
- In the cell to calculate enter the formula: = LOGNORM.DIST (D6, D7, D8, D10)
- Press Enter -> probability plot distribution. was:
Above are instructions and some specific examples when using the LOGNORM.DIST function in Excel.
Good luck!
Was this article helpful?
Your feedback helps us improve.
Related Articles
 LOGNORM.INV function - The function returns the inverse of the logarithmic distribution of x in Excel2 minutes read
 WEIBULL function - The function returns the Weibull distribution in Excel3 minutes read
 GAMMA.INV function - The function returns the inverse of the gamma distribution in Excel2 minutes read
 GAMMA.DIST function - The function returns the gamma distribution in Excel3 minutes read
 CHIDIST function - Function returns the right end probability of the distribution when squared in Excel2 minutes read
 POISSON.DIST function - The function returns the Poisson distribution in Excel2 minutes read
Reader Comments 0
Sign in with email or Google to join the discussion.