WEIBULL function - The function returns the Weibull distribution in Excel
The function performs the calculation and returns the Weibull distribution. Based on this distribution to analyze reliability in theory such as calculating the average life of the device or used in the field of meteorology, hydrology and weather forecast.
Table of Contents
The following article details how to use the WEIBULL function, the function returns the Weibull distribution.
Description : The function performs calculations and returns the Weibull distribution. Based on this distribution to analyze reliability in theory such as calculating the average life of the device or used in the field of meteorology, hydrology and weather forecast.
Syntax : WEIBULL (x, alpha, beta, cumulative) .
Inside:
- x : Value used to evaluate the function, is a required parameter.
- alpha : A parameter to the distribution, is a required parameter.
- beta : A parameter to the distribution, a required parameter.
- cumulative : Logical value to determine the form of the function, is a required parameter. Cumulative has the following 2 values:
+ cumulative = True -> calculates the Weibull cumulative distribution function.
+ cumulative = False -> perform calculation of the distribution function of the Weibull probability density function.
Attention:
- Case 1 of 3 parameters x , alpha , beta are not numbers -> function returns the error value #VALUE !
- x <0 -> function returns the #NUM! error value
- If alpha ≤ 0 or beta ≤ 0 -> the function returns the #NUM! Error value
- When alpha = 1 function returns exponential distribution with:

- Weibull cumulative distribution function equation:

- Weibull probability density function equation:
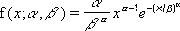
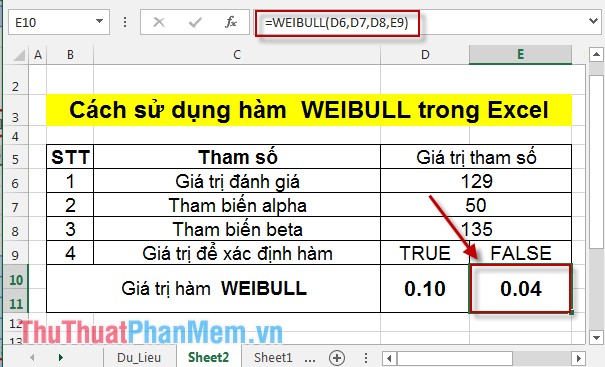
For example:
Calculate the Weibull distribution when knowing the following parameters:
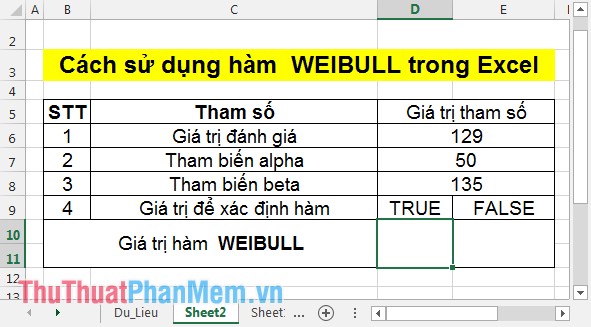
1. Calculate the Weibull cumulative distribution function value with the value that determines the function = TRUE
In the cell to calculate enter the formula: = WEIBULL (D6, D7, D8, D9) .
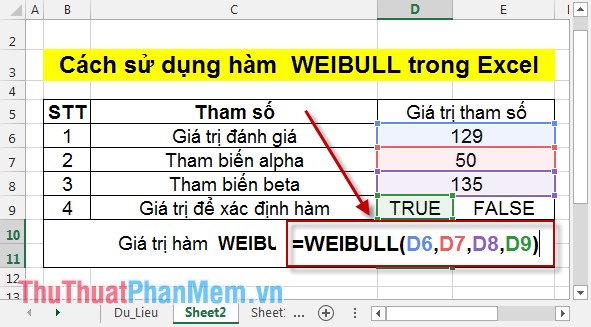
Press Enter -> the cumulative distribution function value WEIBULL is:
2. Calculate the value of the Weibull probability density function with the value that determines the function = FALSE
In the cell to calculate enter the formula: = WEIBULL (D6, D7, D8, E9) .

Press Enter -> Weibull probability density function value is:
Above is how to use the Weibull function and the notes while using. Hope to help you.
Good luck!
Was this article helpful?
Your feedback helps us improve.
Related Articles
 GAMMA.INV function - The function returns the inverse of the gamma distribution in Excel2 minutes read
 GAMMA.DIST function - The function returns the gamma distribution in Excel3 minutes read
 CHIDIST function - Function returns the right end probability of the distribution when squared in Excel2 minutes read
 POISSON.DIST function - The function returns the Poisson distribution in Excel2 minutes read
 How to use the NORMDIST function in Excel - Function that returns the distribution in Excel3 minutes read
 BETA.DIST function - The function returns the Beta distribution in Excel3 minutes read
Reader Comments 0
Sign in with email or Google to join the discussion.