The following article introduces you to the LOGEST function - one of the functions in the statistical function group is very popular in Excel.

Description: The function returns the array of data describing the exponential curve in accordance with the given data.
- The equation of the curve is:
y = b * m ^ x
or
y = (b * (m1 ^ x1) * (m2 ^ x2) * _)
Syntax: LOGEST (known_y's, [known_x's], [const], [stats])
Inside:
- known_y's : The set of known y values in the relationship y = b * m ^ x, is a required parameter.
+ If known_y's is in a single column or row -> each known_y's column or row is interpreted as a separate variable.
- known_x's: The set of known x values in the relationship y = b * m ^ x, is a required parameter.
+ known_x's may include 1 or more sets of variables.
+ If known_x's is omitted -> it is assumed to be an array of the same size as known_y's
- const: The logical value determining the value of the constant b, is an optional value including the following values:
+ const = True or ignore -> b is calculated normally.
+ const = False or ignore -> b = 1 and m are adjusted such that: y = m ^ x.
- stats: The logical value that determines the return value with additional regression statistics, is an optional value that includes:
+ stats = True -> returns additional regression statistics.
+ stats = False -> returns the coefficient m and the constant b .
Attention:
- The more similar the graph to the exponential curve -> the better the calculated straight line is for your data.
- Where there is only 1 independent variable x -> find the value of the intersection y according to the following formula:
+ Crossing Y (b): INDEX (LOGEST (known_y's, known_x's), 2)
- When entering array constants, you must use commas to separate.
- If the values y are outside the values used to define the equation -> the regression equation may be invalid.
For example:
Find the value as described in the data table below:

1. Calculate the value of the LOGEST function with additional regression statistics (corresponding to stats = True).
- In the cell to calculate enter the formula : = LOGEST (D6: D10, C6: C10, TRUE, TRUE)

- Press Enter -> the return value of the function is:

2. Calculate the value of the LOGEST function with stats = False.
- In the cell to calculate enter the formula: = LOGEST (D6: D10, C6: C10, TRUE, FALSE)
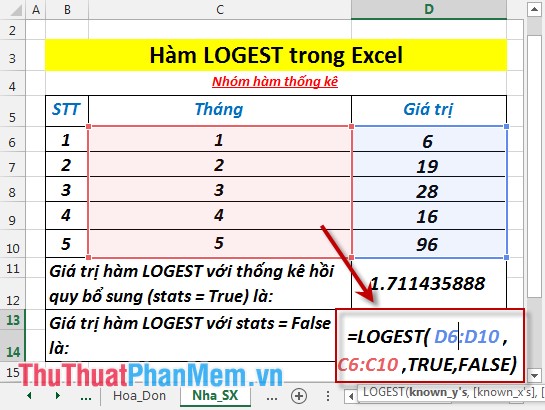
- Press Enter -> return value is:

Above are instructions and some specific examples when using the LOGEST function in Excel.
Good luck!


 How to make snow fall in Scratch
 How to create, validate, and modify the Identity column in Microsoft SQL Server
 How to use the LOOKUP function in Excel - Data search function
 How to permanently disable AI on Google Chrome
 Instructions to enable safe file downloads on Google Chrome
 Common errors in Excel and effective ways to fix them