DEVSQ function in Excel The function returns the sum of squares of deviations between data points from their average
DEVSQ () is a function that returns the sum of squares of deviations between data points from their average.
Table of Contents
Sometimes you need to calculate the sum of squares of deviations between data points from its average. The DEVSQ () function helps you make this request. If you do not know the syntax and usage of DEVSQ () function, you can follow the article below.
The article describes the syntax and usage of the DEVSQ () function to calculate the sum of squares of deviations in Excel.
Description
DEVSQ () is a function that returns the sum of squares of deviations between data points from their average.
Syntax
= DEVSQ (number1, number2, .)
Inside:
number1: the first argument, required.
number2: is the next parameter, optional and up to 255 arguments that you want to calculate the square of their deviation.
number1, number2 . can be numbers directly separated by commas, an array, or an array reference.
Note
- Arguments number1, number2 . can be numbers or names, an array or a reference containing numbers.
- Ignore arguments that are arrays or references to cells that contain text, logical values, or empty cells except the value of 0 (zero).
- The logical values and text representations form that you enter directly into the argument list will be calculated.
- If the arguments are entered directly as text or the values cannot be converted into numbers, the function will report an error.
- Equation summing squared deviations:

For example
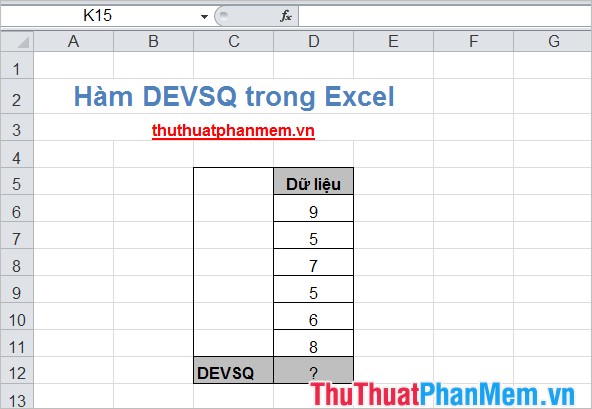
Calculate the sum of squares of deviations of numbers in the Data column .
Applying DEVSQ (): = DEVSQ (D6: D11) we get the following result:
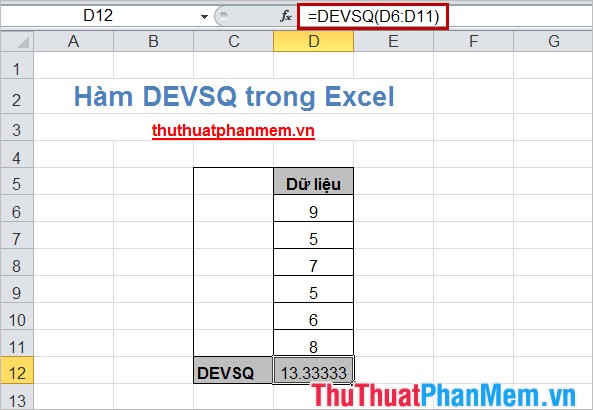
You can also enter numbers directly into the function: = DEVSQ (9,5,7,5,6,8)

DEVSQ () function is also one of the functions with quite simple syntax and usage, you can quickly remember the syntax and know how to use DEVSQ () function to calculate the sum of squared deviations in Excel. Good luck!
Was this article helpful?
Your feedback helps us improve.
Related Articles
 DEVSQ function - The function returns the sum of squares of deviations of data points from the sample mean in Excel2 minutes read
 COVARIANCE.S function - Returns the covariance pattern, the average of product deviations for each pair of data points in two data sets in Excel2 minutes read
 COVARIANCE.P function - The function returns the covariance of a set, the product of the average of degrees of instruction for each pair of data points in Excel3 minutes read
 AVEDEV function - The function returns the average absolute deviation of data points from their midpoint in Excel2 minutes read
 GEOMEAN function - The function returns the average of a positive array or range of data in Excel2 minutes read
 TRIMMEAN function - The function returns the average of the inner part of a dataset in Excel2 minutes read
Reader Comments 0
Sign in with email or Google to join the discussion.