HYPGEOM.DIST - The function returns the hyperbolic distribution in Excel
The following article introduces you to the HYPGEOM.DIST function - one of the functions in the statistical group is very popular in Excel.
Description: The function returns the hypergeometric distribution, using this function for whether finite set of vowismooix observations can be successful or not.
Syntax: HYPGEOM.DIST (sample_s, number_sample, population_s, number_pop, cumulative)
Inside:
- sample_s: Number of successes in the sample, a required parameter.
- number_sample: The size of the sample, is a required parameter.
- population_s: Number of successes, required.
- number_pop: Size of the collection, is the required parameter.
- cumulative: A logical value that determines the form of the function, which is an optional parameter consisting of the following values:
+ cumulative = True -> returns the cumulative distribution function.
+ cumulative = False -> returns the probability density function.
Attention:
- Any arguments of functions that are not whole numbers -> they are truncated into integers.
- If any argument value is not a number form -> the function returns the #VALUE! Error value
- If sample_s <0 or sample_s is bigger than the smaller of two: number_sample or population_s -> the function returns the #NUM! Error value
- If sample_s is smaller than the bigger of the two: 0 and ( number_sample - number_population + population_s ) -> the function returns the #NUM! Error value !
- If number_sample ≤ 0 or number_sample> number_population -> the function returns the #NUM! Error value
- If population_s ≤ 0 or population_s> number_population -> the function returns the #NUM! Error value
- If number_pop ≤ 0 -> the function returns the #NUM! Error value
- The hyperbolic distribution equation is:
[Pleft ({X = x} right) = hleft ({x; n, M, N} right) = frac {{left ({begin {array} {* {20} {c}}
M
x
end {array} } right) left ({begin {array} {* {20} {c}}
{N - M,}
{n - x}
end {array}} right)}} {{left ({begin {array} {* {20} {c}}
N
n
end {array}} right)}}]
Inside:
+ x = sample_s
+ n = number_sample
+ M = population_s
+ N = number_pop
- The HYPGEOM.DIST function is for sampling but does not replace a finite set.
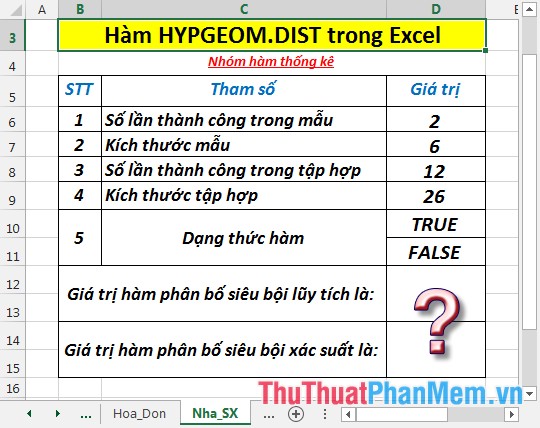
For example:
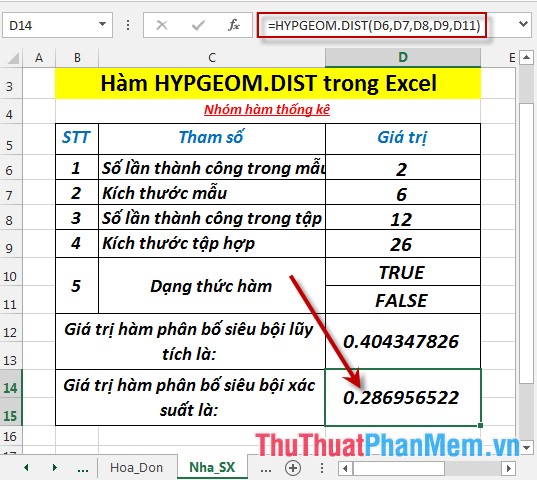
Calculate the cumulative hypercapacity and probability distribution function with the data in the following data table:
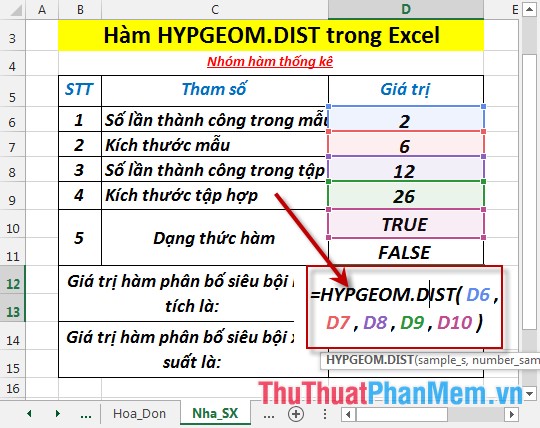
- Calculate the value of cumulative super multiple function. In a cell to calculate, enter the formula : = HYPGEOM.DIST (D6, D7, D8, D9, D10)
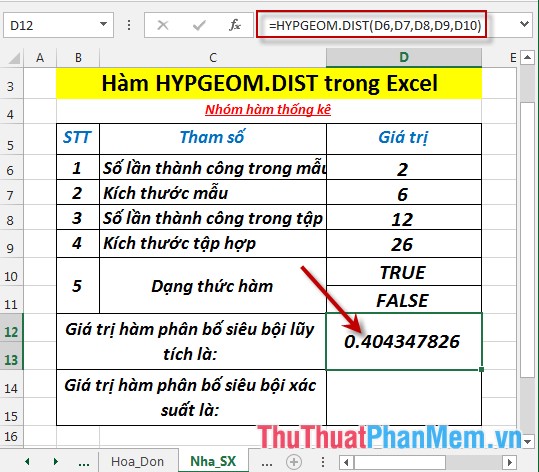
- Press Enter -> the value of cumulative super multiple function is:
- Calculate the value of the probability super function. In a cell to calculate, enter the formula : = HYPGEOM.DIST (D6, D7, D8, D9, D11)
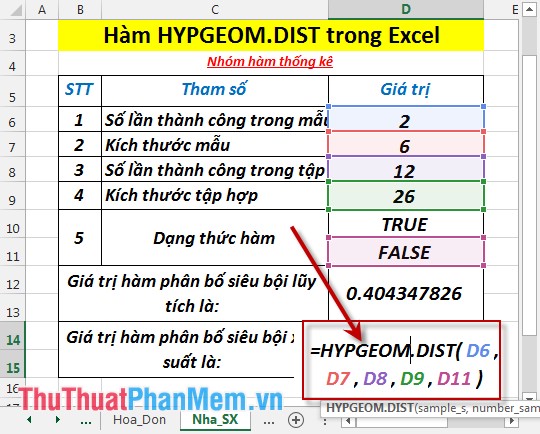
- Press Enter -> probability super function value is:
Above are instructions and some specific examples when using HYPGEOM.DIST function in Excel.
Good luck!
You should read it
- BETA.DIST function - The function returns the Beta distribution in Excel
- T.DIST.RT - The function returns the Student's t-distribution on the right in Excel
- F.DIST - The function returns the probability distribution F in Excel
- LOGNORM.DIST - Function returns the logarithmic distribution of x in Excel
- T.DIST - The function returns the Student t-distribution on the left in Excel
- CHISQ.DIST - Function returns the distribution when squared in Excel
- T.DIST.2T - The function returns the two-tailed Student distribution in Excel
- NORM.S.DIST function - The function returns the normalized distribution with a mean of 0 and a standard deviation of 1 in Excel
May be interested
- LOGNORM.INV function - The function returns the inverse of the logarithmic distribution of x in Excellognorm.inv: the function returns the inverse of the logarithmic distribution of x. where ln (x) is usually distributed with parameter mean and standard deviation. use functions to analyze logarithmic change data. support function from excel 2 version
- T.INV function - The function returns the inverse value of the Student t distribution in Excelt.inv: the function returns the inverse value of the student t-distribution. support functions from excel 2010 onwards. syntax: t.inv (probability, deg_freedom)
- T.DIST.RT - The function returns the Student's t-distribution on the right in Excelt.dist.rt: the function returns the student's t-distribution on the right. functions used in testing the hypothesis of small numbers of data sets. support functions from excel 2010 onwards. syntax: t.dist.rt (x, deg_freedom)
- F.DIST - The function returns the probability distribution F in Excelf.dist function: the function returns the probability distribution f. the function supports the version from excel 2010. syntax: f.dist (x, deg_freedom1, deg_freedom2, cumulative)
- F.INV function - The function returns the inverse of the probability distribution F in Excelf.inv function: the function returns the inverse of the probability distribution f. support function from the excel 2010 version. syntax: f.inv (probability, deg_freedom1, deg_freedom2)
- F.INV.RT function - The function returns the right-inverse head value of the probability distribution F in Excelf.inv.rt function: the function returns the inverse of the right probability distribution f. support functions from the excel 2010 version. syntax: f.inv.rt (probability, deg_freedom1, deg_freedom2)
- CHISQ.DIST - Function returns the distribution when squared in Excelchisq.dist: the function returns the distribution when squared, and this value is often used to understand variations as a percentage of the samples. support function from excel 2010 version. syntax: chisq.dist (x, deg_freedom, cumulative)
- LOGNORM.DIST - Function returns the logarithmic distribution of x in Excellognorm.dist: the function returns the logarithmic distribution of x. where ln (x) is usually distributed with parameter mean and standard deviation. support functions from excel 2010 onwards. syntax: lognorm.dist (x, mean, standard_dev, cumulative)
- T.DIST - The function returns the Student t-distribution on the left in Excelt.dist: the function returns the student's t-distribution on the left. functions used in testing the hypothesis of small numbers of data sets. support functions from excel 2010 onwards. syntax: t.dist (x, deg_freedom, cumulative)
- T.DIST.2T - The function returns the two-tailed Student distribution in Excelt.dist.2t: the function returns the two-tailed student's t-distribution. functions used in testing the hypothesis of small numbers of data sets. support functions from excel 2010 onwards. syntax: t.dist.2t (x, deg_freedom)